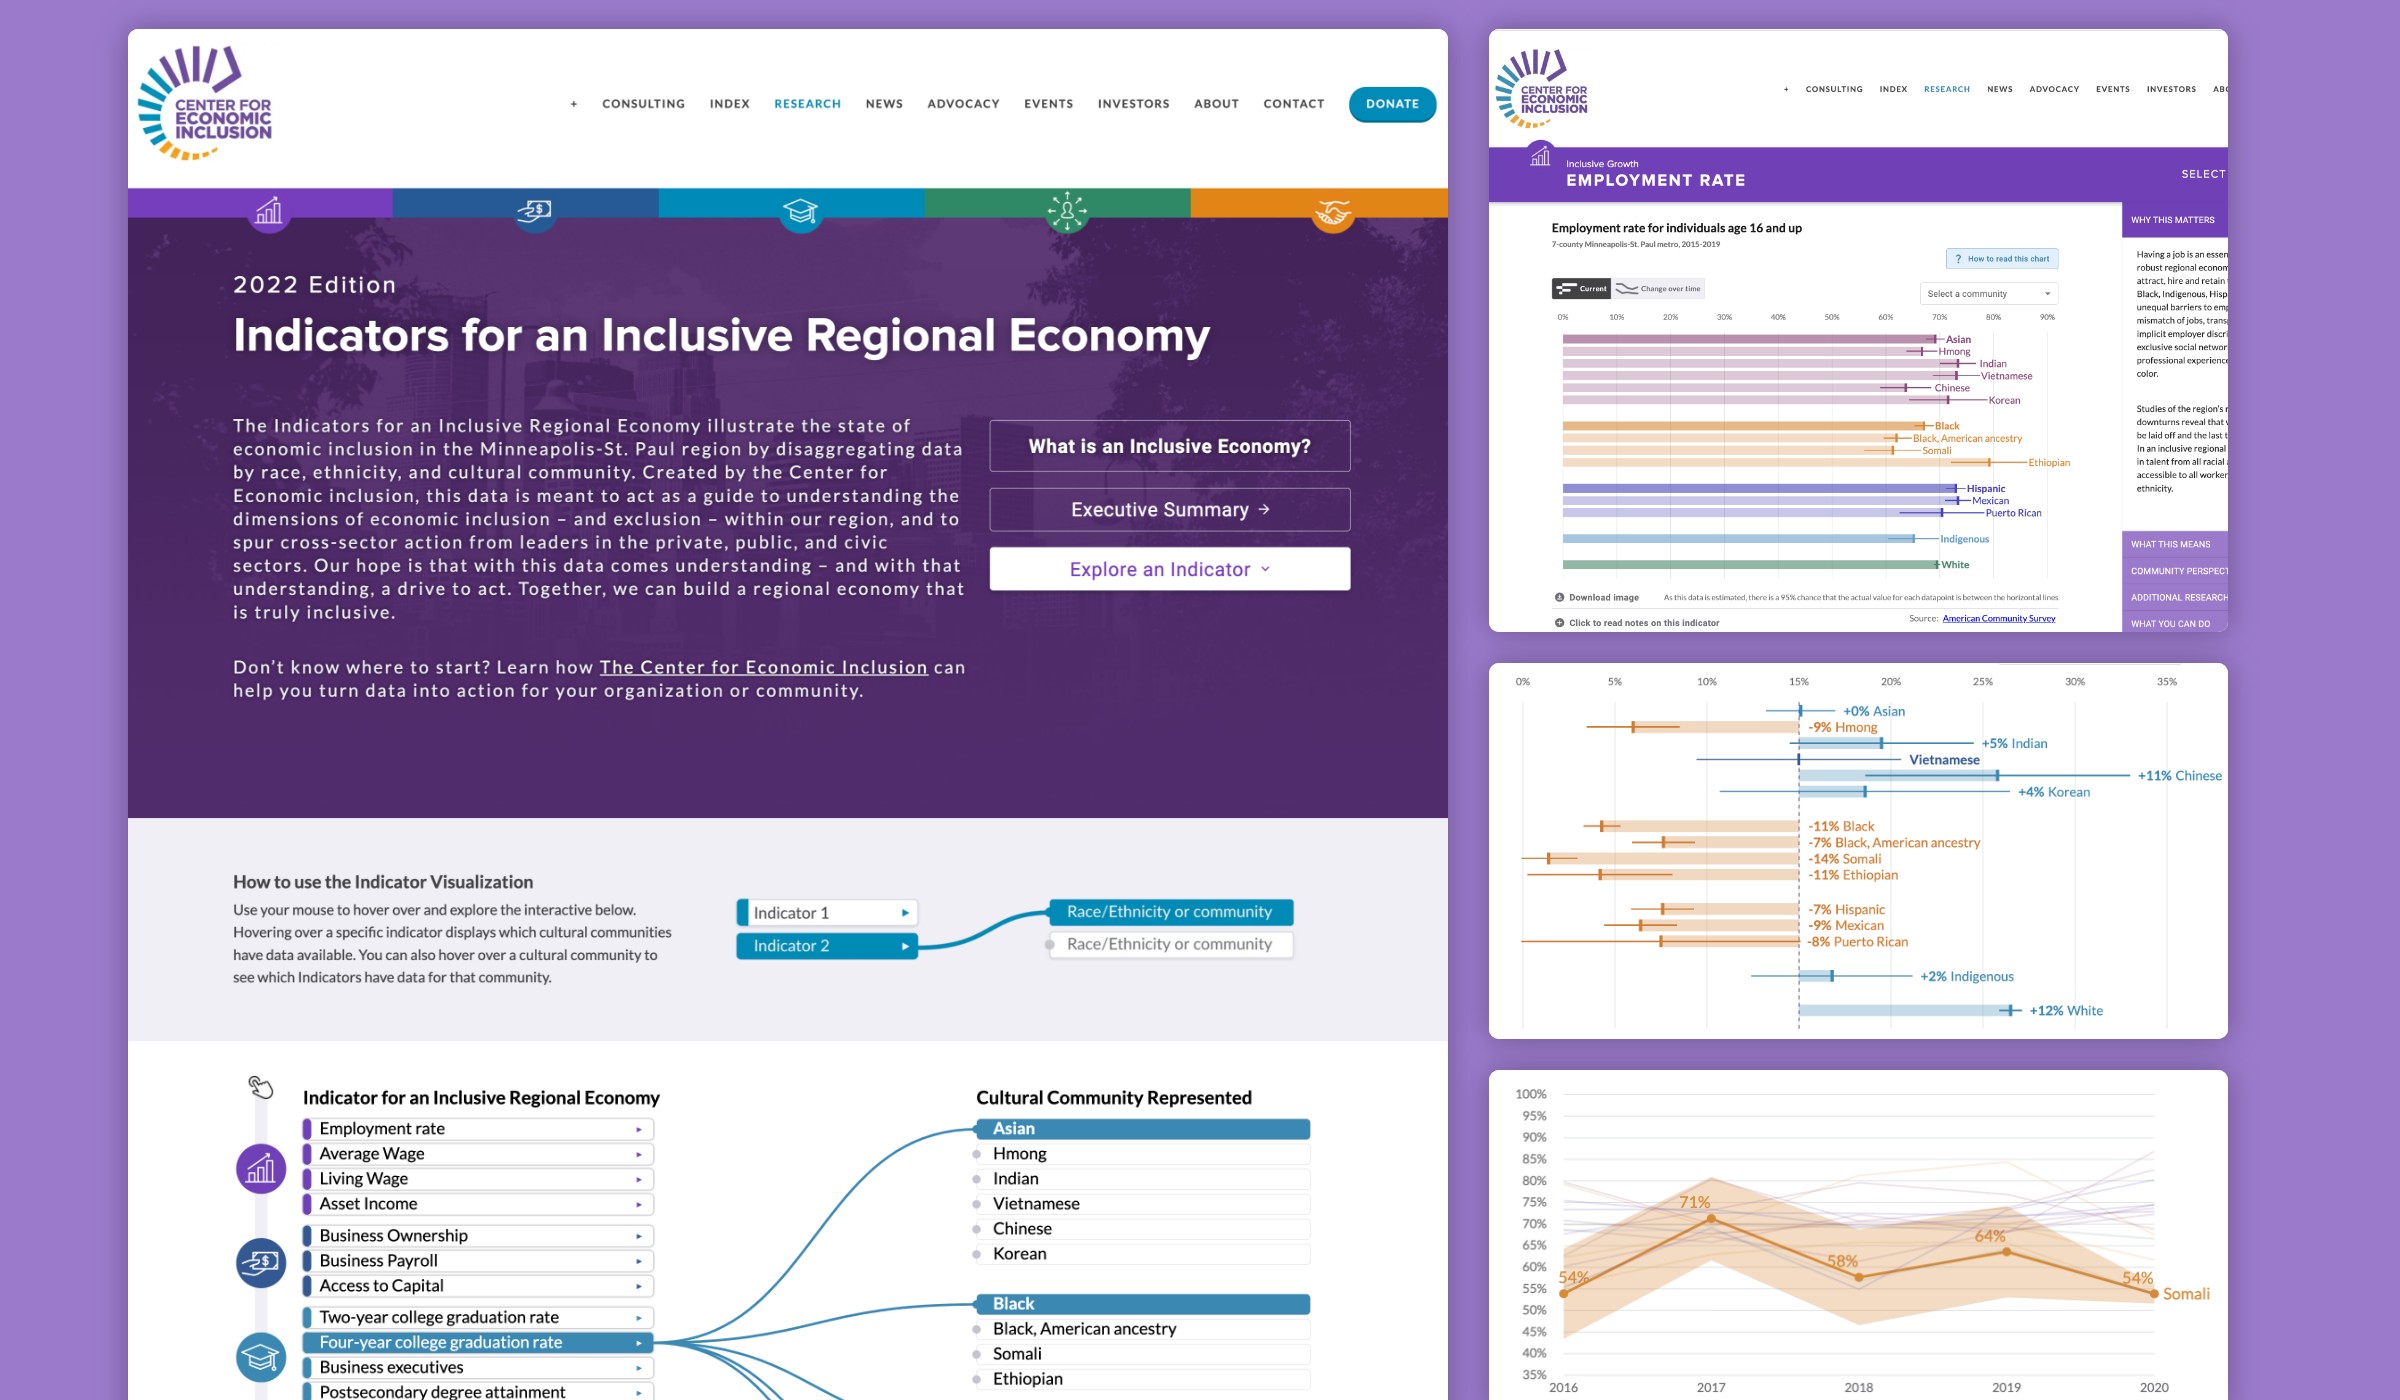
The new Indicator’s website needed to be more usable and more useful. That meant a better interactive design, more data, and an updated system of aggregation to provide actionable insights at a community level.
Working with the Center’s team, Graphicacy enhanced the existing data through national and regional sources, and expanded the Indicators website into an interactive microsite. Additions included:
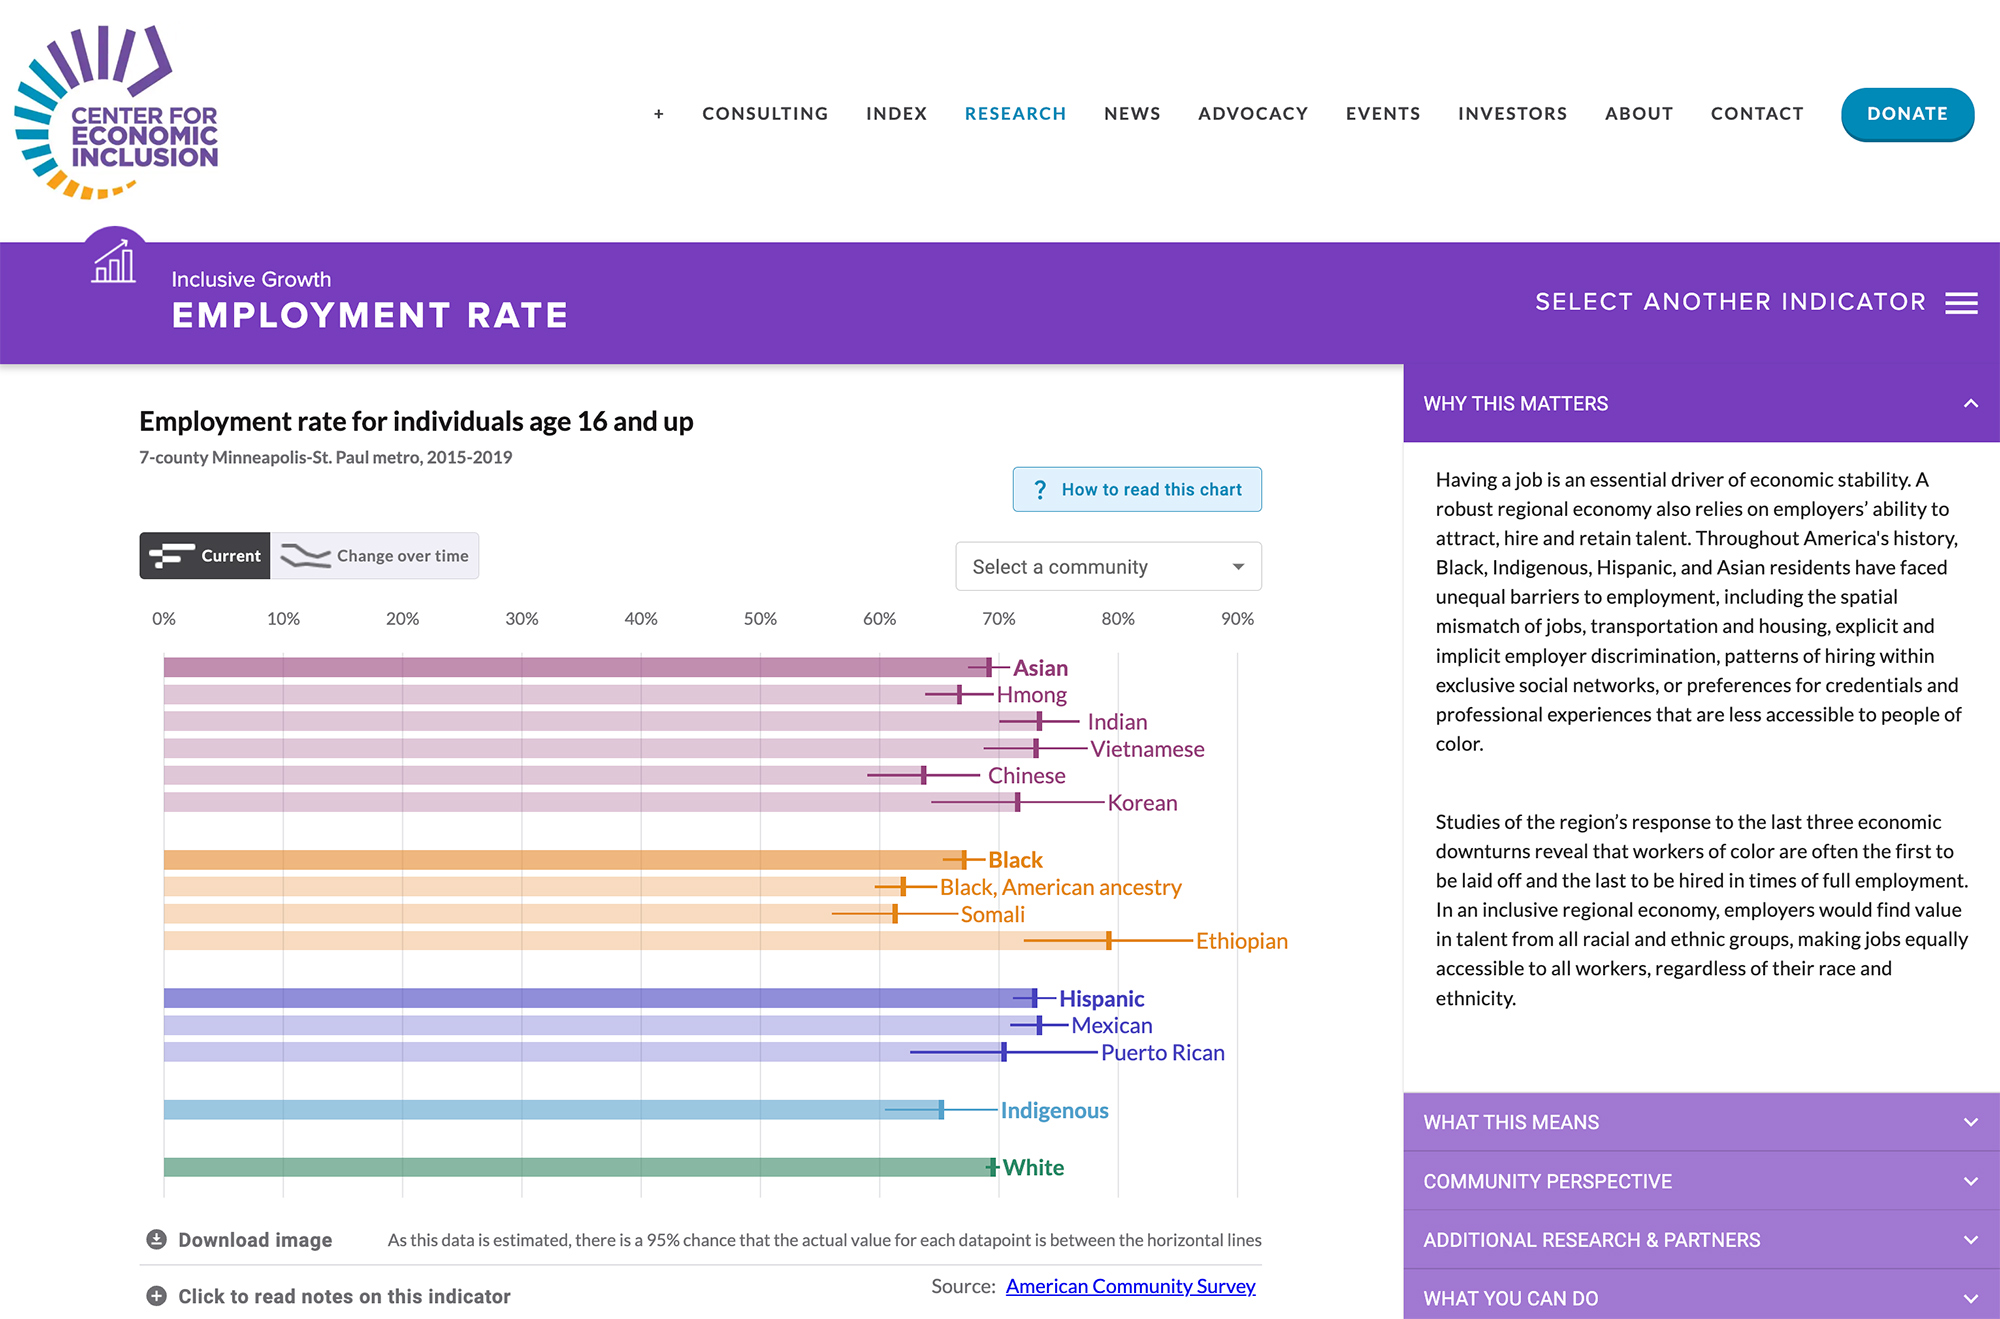
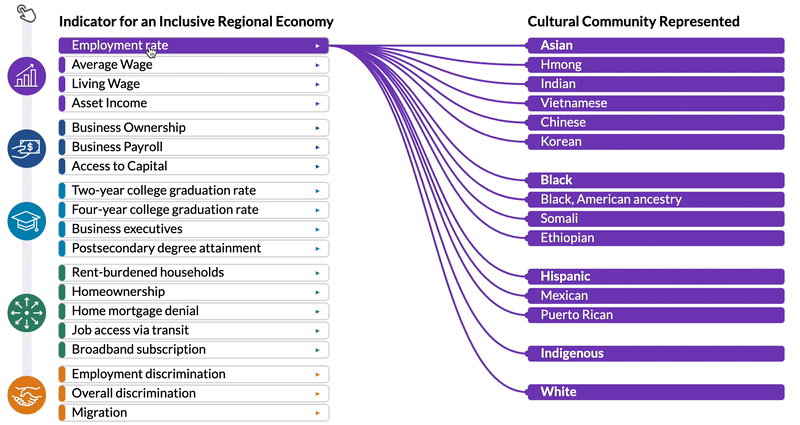
- Data disaggregated from broader race and ethnicity categories to include 10 cultural communities (such as Hmong, Mexican, and Somali residents)
- Indicators with unique insights around earning a living wage, mortgage discrimination, and access to public transit
A fifth Indicator Pillar labeled Sense of Belonging to gauge how welcome residents feel in the region
- Narrative context explaining what the data for each Indicator means, why it matters, and what actions users can take
- An executive summary showing major highlights from all Pillars in one place
- An interactive Indicator Visualization on the landing page showing which Indicators are available for which communities (and where gaps still exist)
“This new platform is like our previous economic Indicators on steroids, times one thousand,” said Tawanna. “It does my heart good to see how Graphicacy brought our rich collection of data to life. We needed to show more of our region’s diversity with disaggregated data so that we were telling everyone’s story. That’s what promoting inclusion is about.”
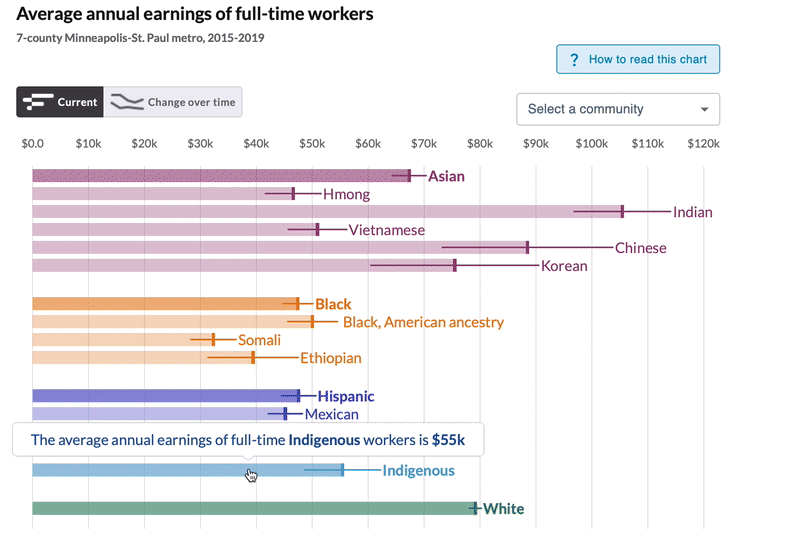
Graphicacy designed the site so users could explore multiple layers depending on how deeply they want to dive in. Custom insights are generated on the fly for users: by hovering over any bar, a small popup appears with a sentence description of the data being shown, along with any relevant comparisons.