Much like an electoral campaign, RUN/51 required a steady stream of support, resources, and awareness to succeed. To that end, Vote Run Lead engaged Graphicacy to create a compelling, data-driven story that draws attention to gender discrepancies while generating excitement around RUN/51 as the solution.
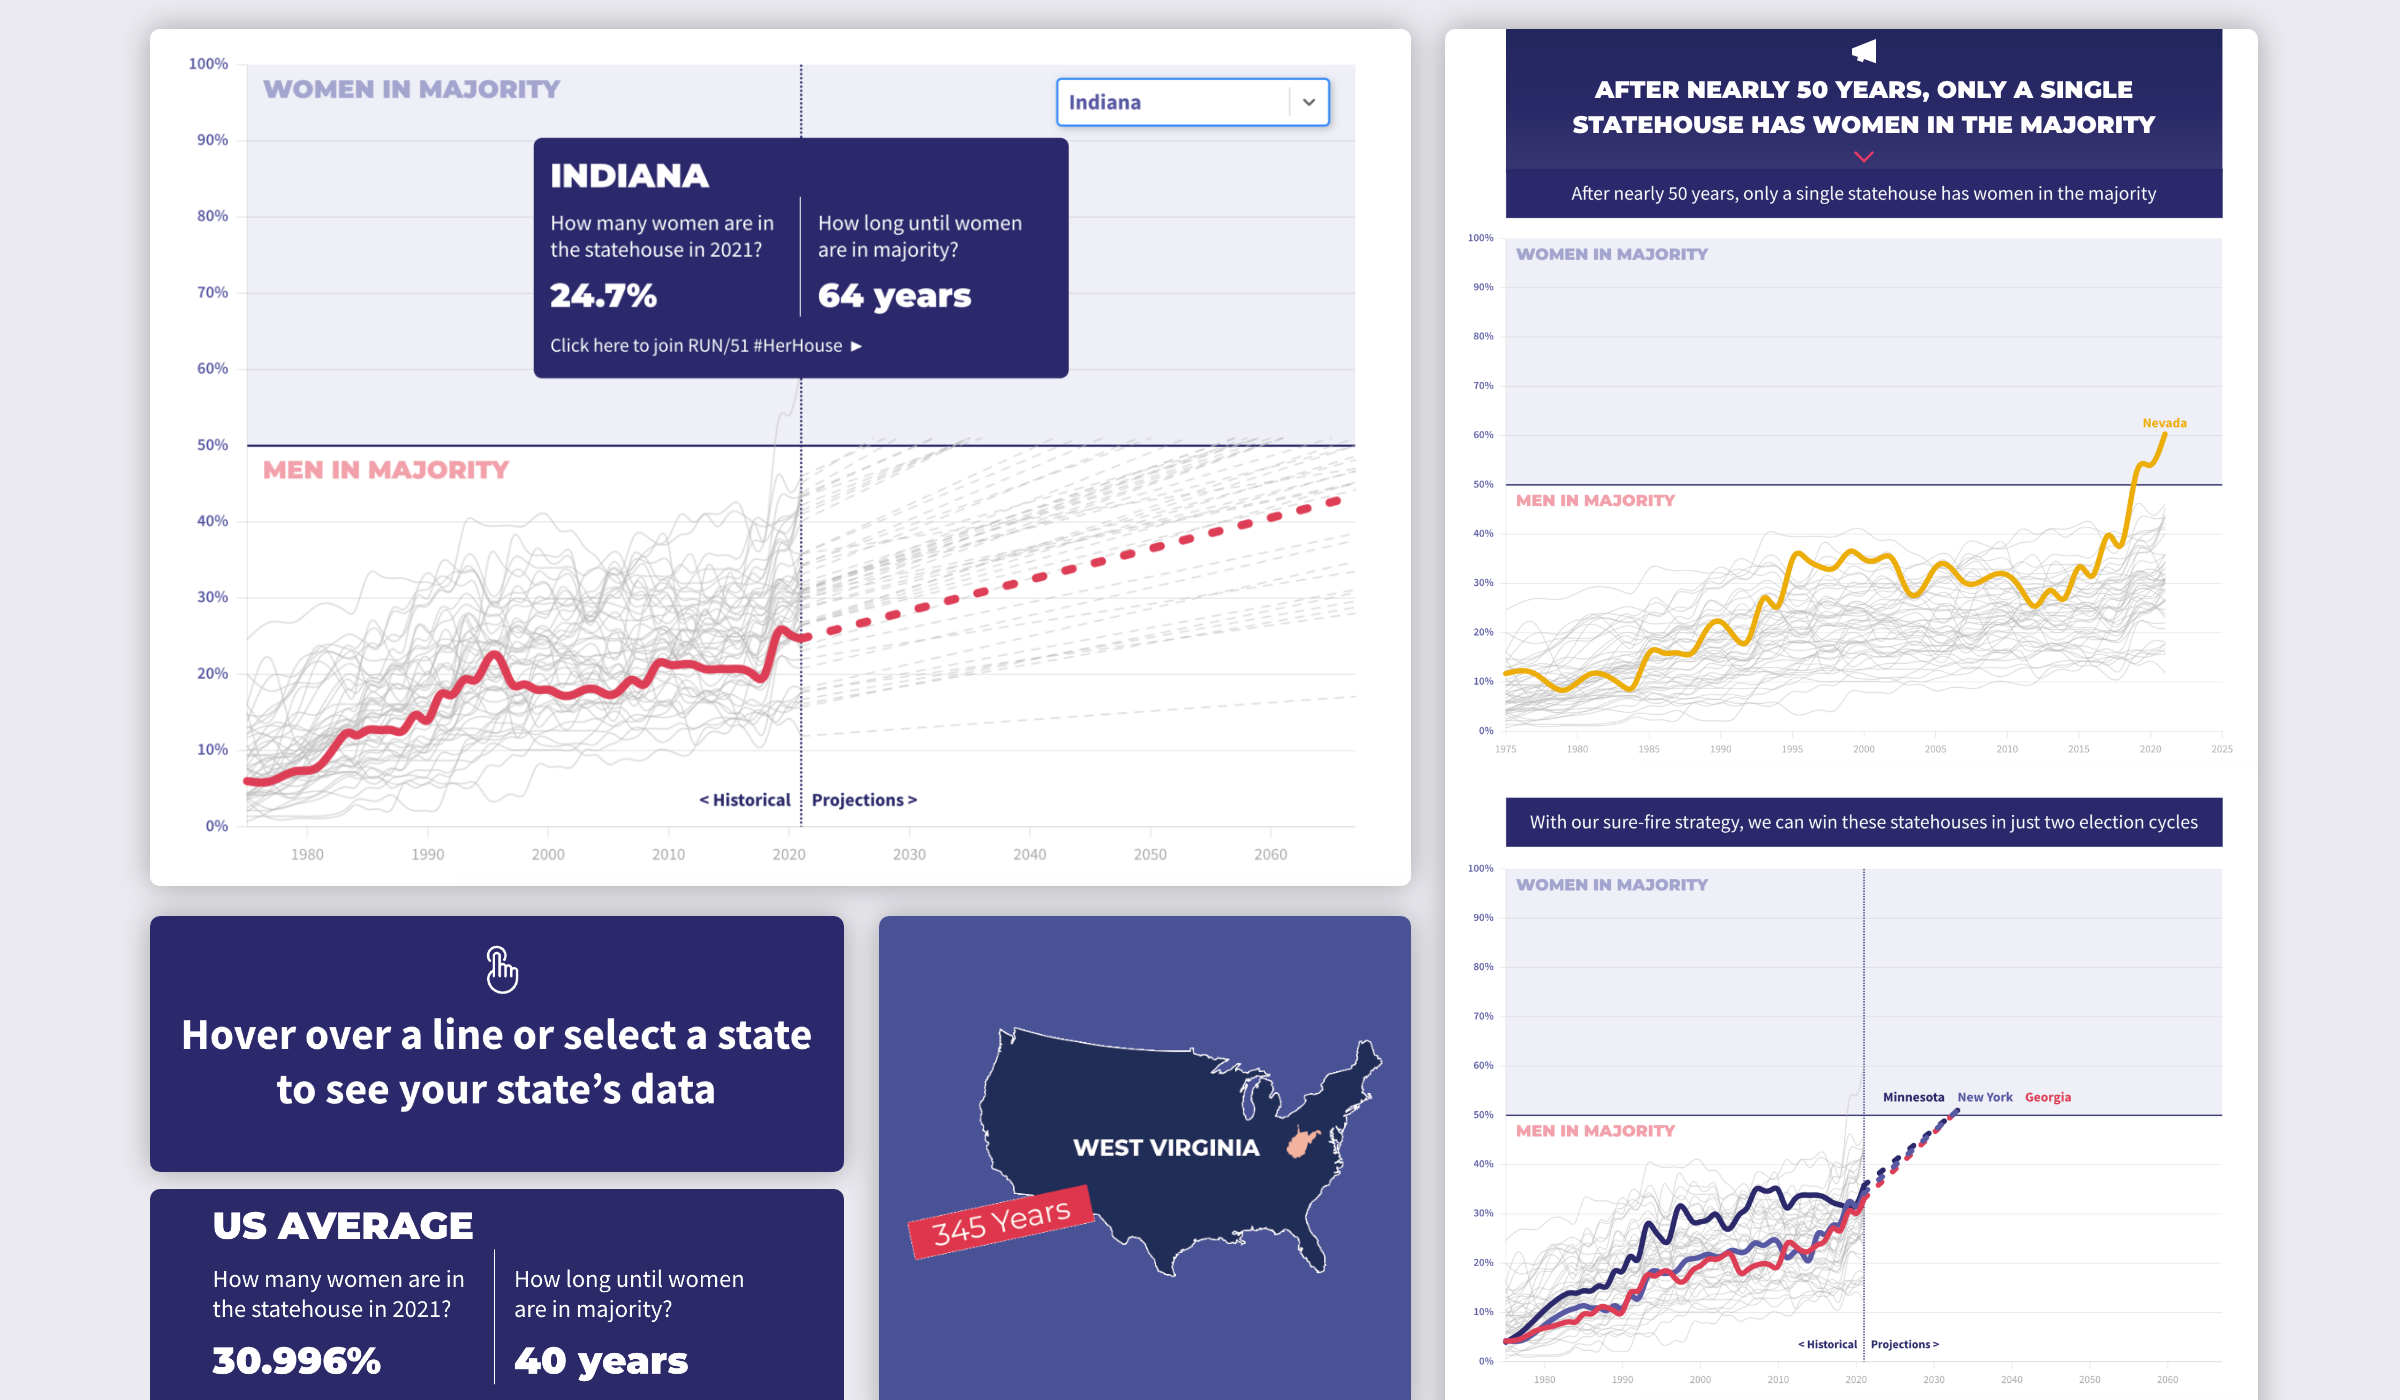
Graphicacy started the project with a blank slate and a short deadline. During an in-depth discovery process, the team speedily parsed a trove of data from multiple sources to identify trends and possible narratives that would inspire audiences to act. From a long list of ideas, Graphicacy and Vote Run Lead agreed upon an interactive scrollytelling approach for the RUN/51 landing page that depicts both the current and future state of gender inequity in state legislatures.
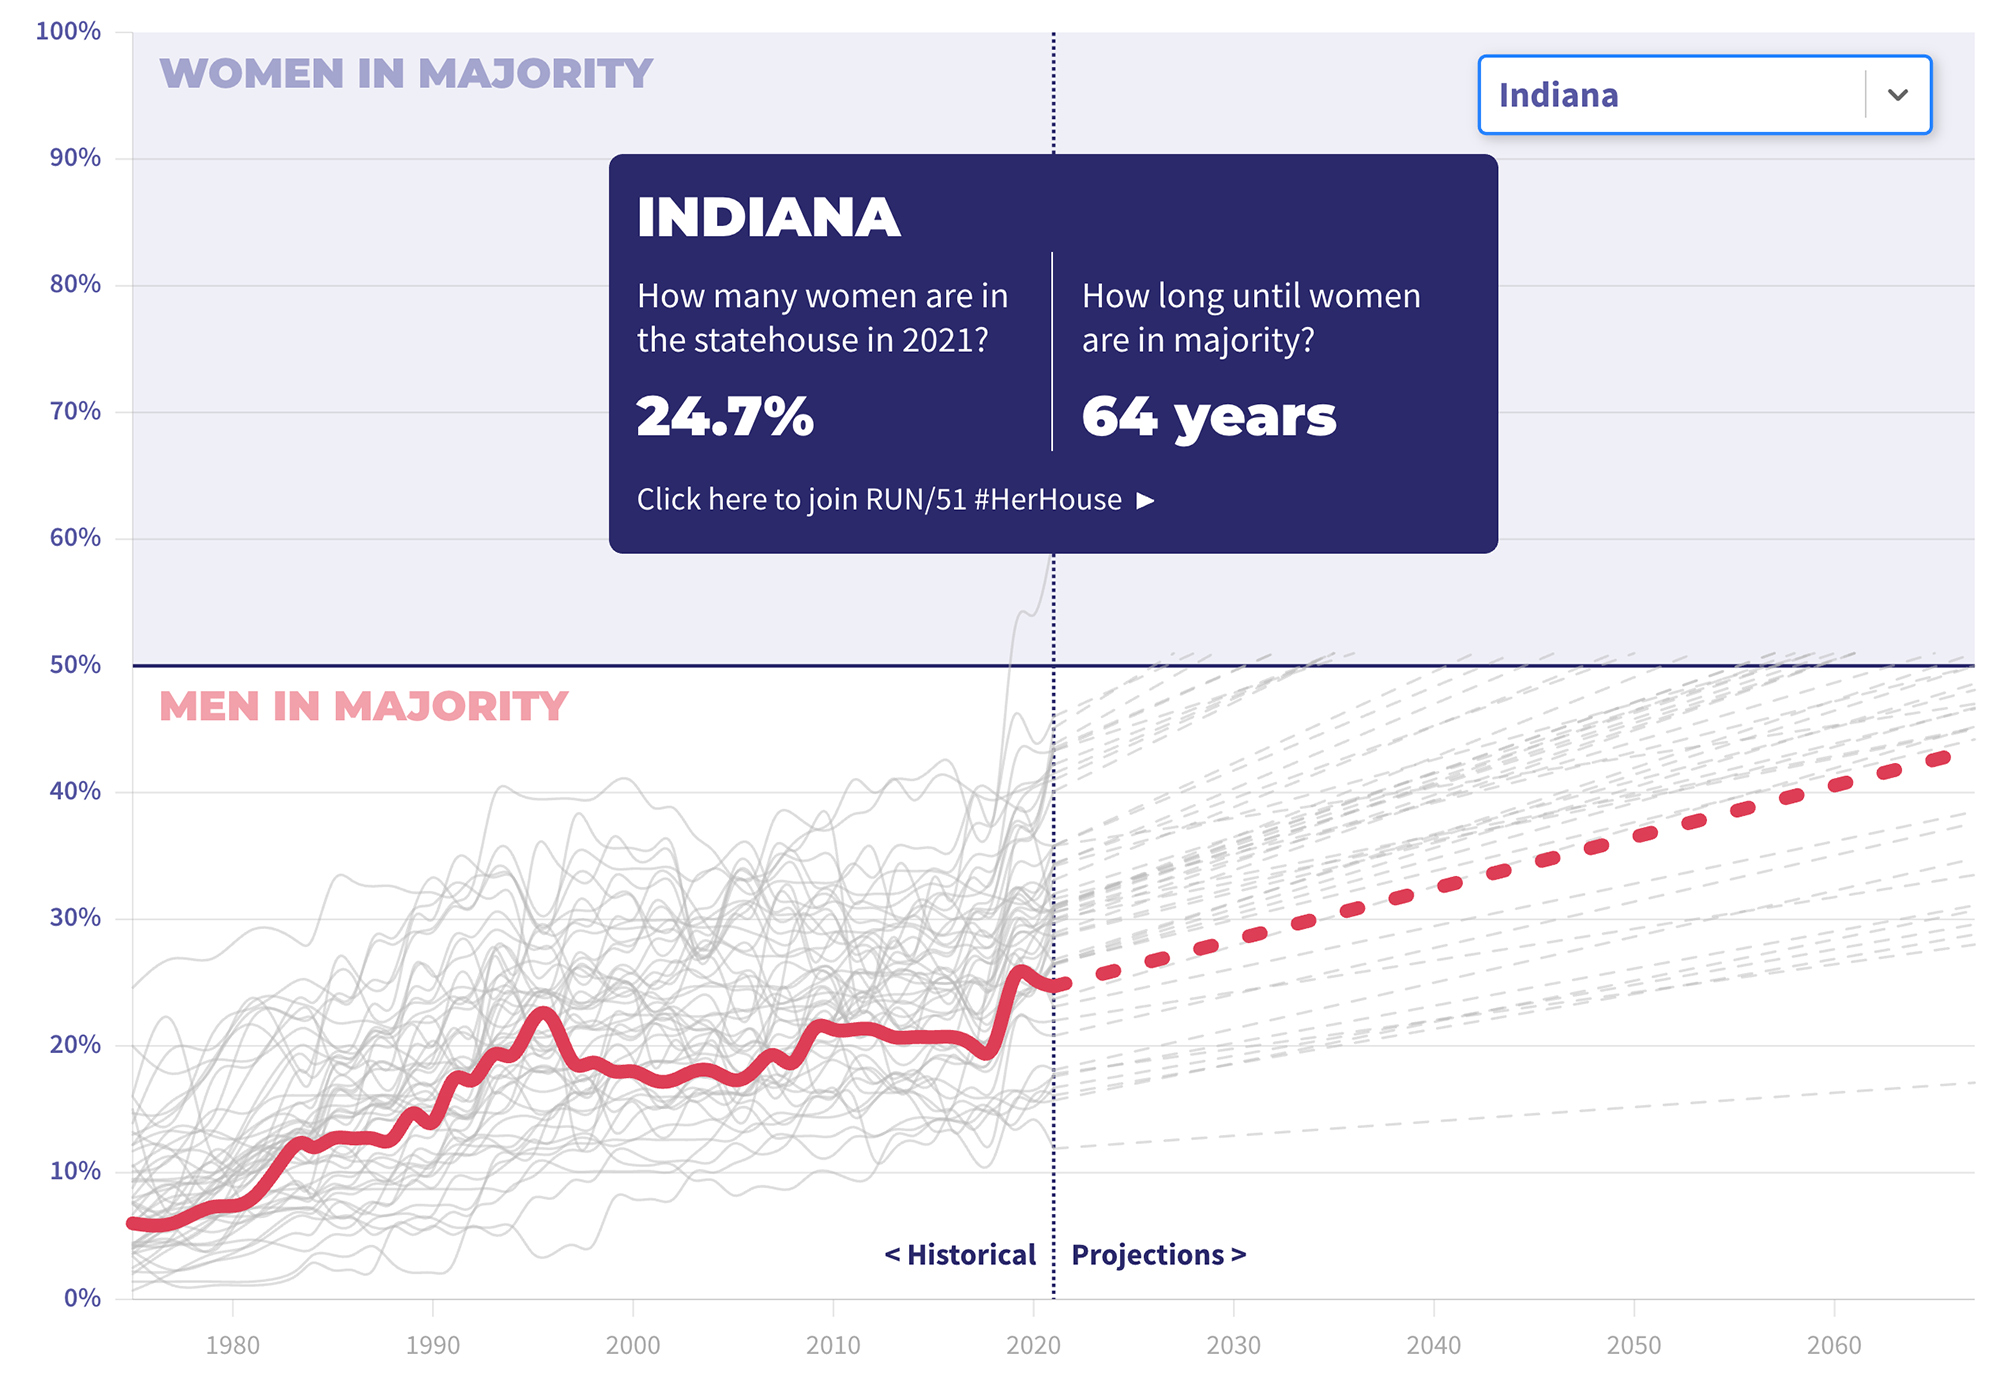
Informed by historic data for statehouse gender composition from Rutgers University’s Center for American Women in Politics, Graphicacy developed a narrative sequence spelling out the gravity of the problem and the goals of RUN/51. In the background, graphics for the three pilot states support the text.
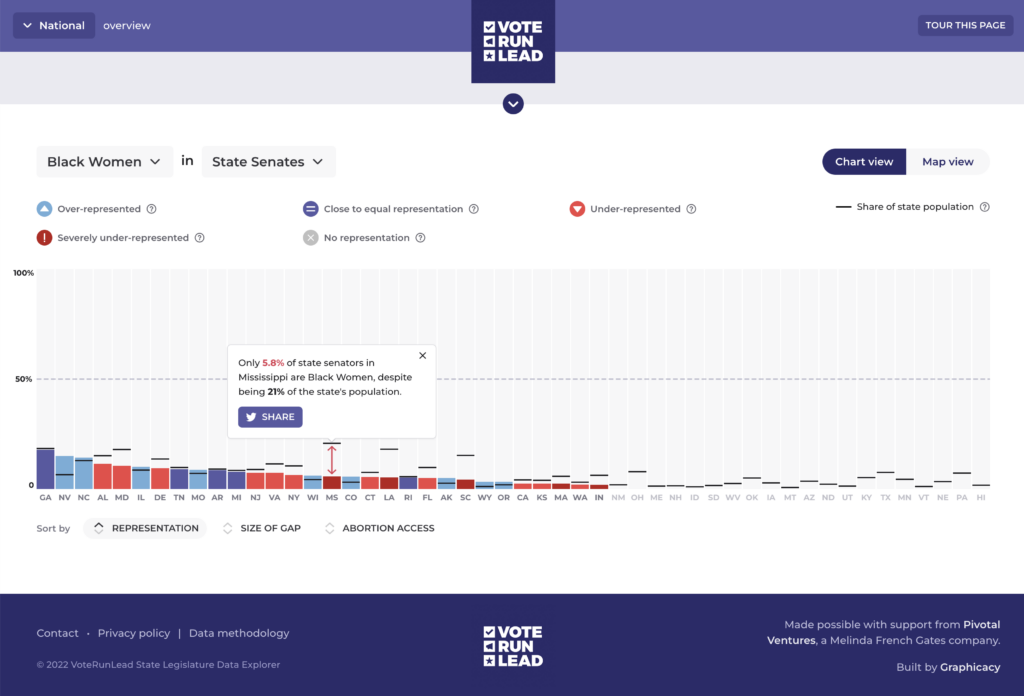
Shareability was another important factor for the visualization. “So many women come to our programs by way of friend referrals,” Amanda O’Donnell, Vote Run Lead Chief Operations Officer O’Donnell said. “Because women can share this visualization across their networks and social media, it has the power to significantly expand our pipeline of candidates and supporters. We will also use this during meetings with potential funders to answer the ‘why’ and ‘how’ of our work. It’s a very powerful conversation starter.”