Climate Culture Index

Rare / 2022 / Environment & Climate Change

A chart created for RARE's Climate Culture Index project, showing there is a sizable gap when people are asked Should others adopt it? vs. Do you think others believe people should adopt it?

Overview

Graphicacy created a set of visualizations to showcase the findings from Rare’s nationwide Climate Culture Index, which asked Americans about their beliefs and attitudes around taking action against climate change.

Background & Challenge

In 2021, Rare conducted a nationwide study, the Climate Culture Index, to measure the state of our beliefs related to climate action—from what individual Americans are thinking (e.g., their mindsets) about various high-impact climate actions to what they are doing about them. The study revealed that people mostly think they are alone in believing everyone else should take action on climate change. By normalizing climate action, showing people that others also think action on climate change is important, it can help people adopt these new behaviors.

Rare commissioned Graphicacy to produce a set of visualizations to communicate their findings, but had some budget and timeline constraints. We used Flourish as a tool to quickly create interactive charts without the need for custom engineering work. This allowed us to deliver on a very fast timeline, and keep the overall cost quite low.

Opportunity & Solution

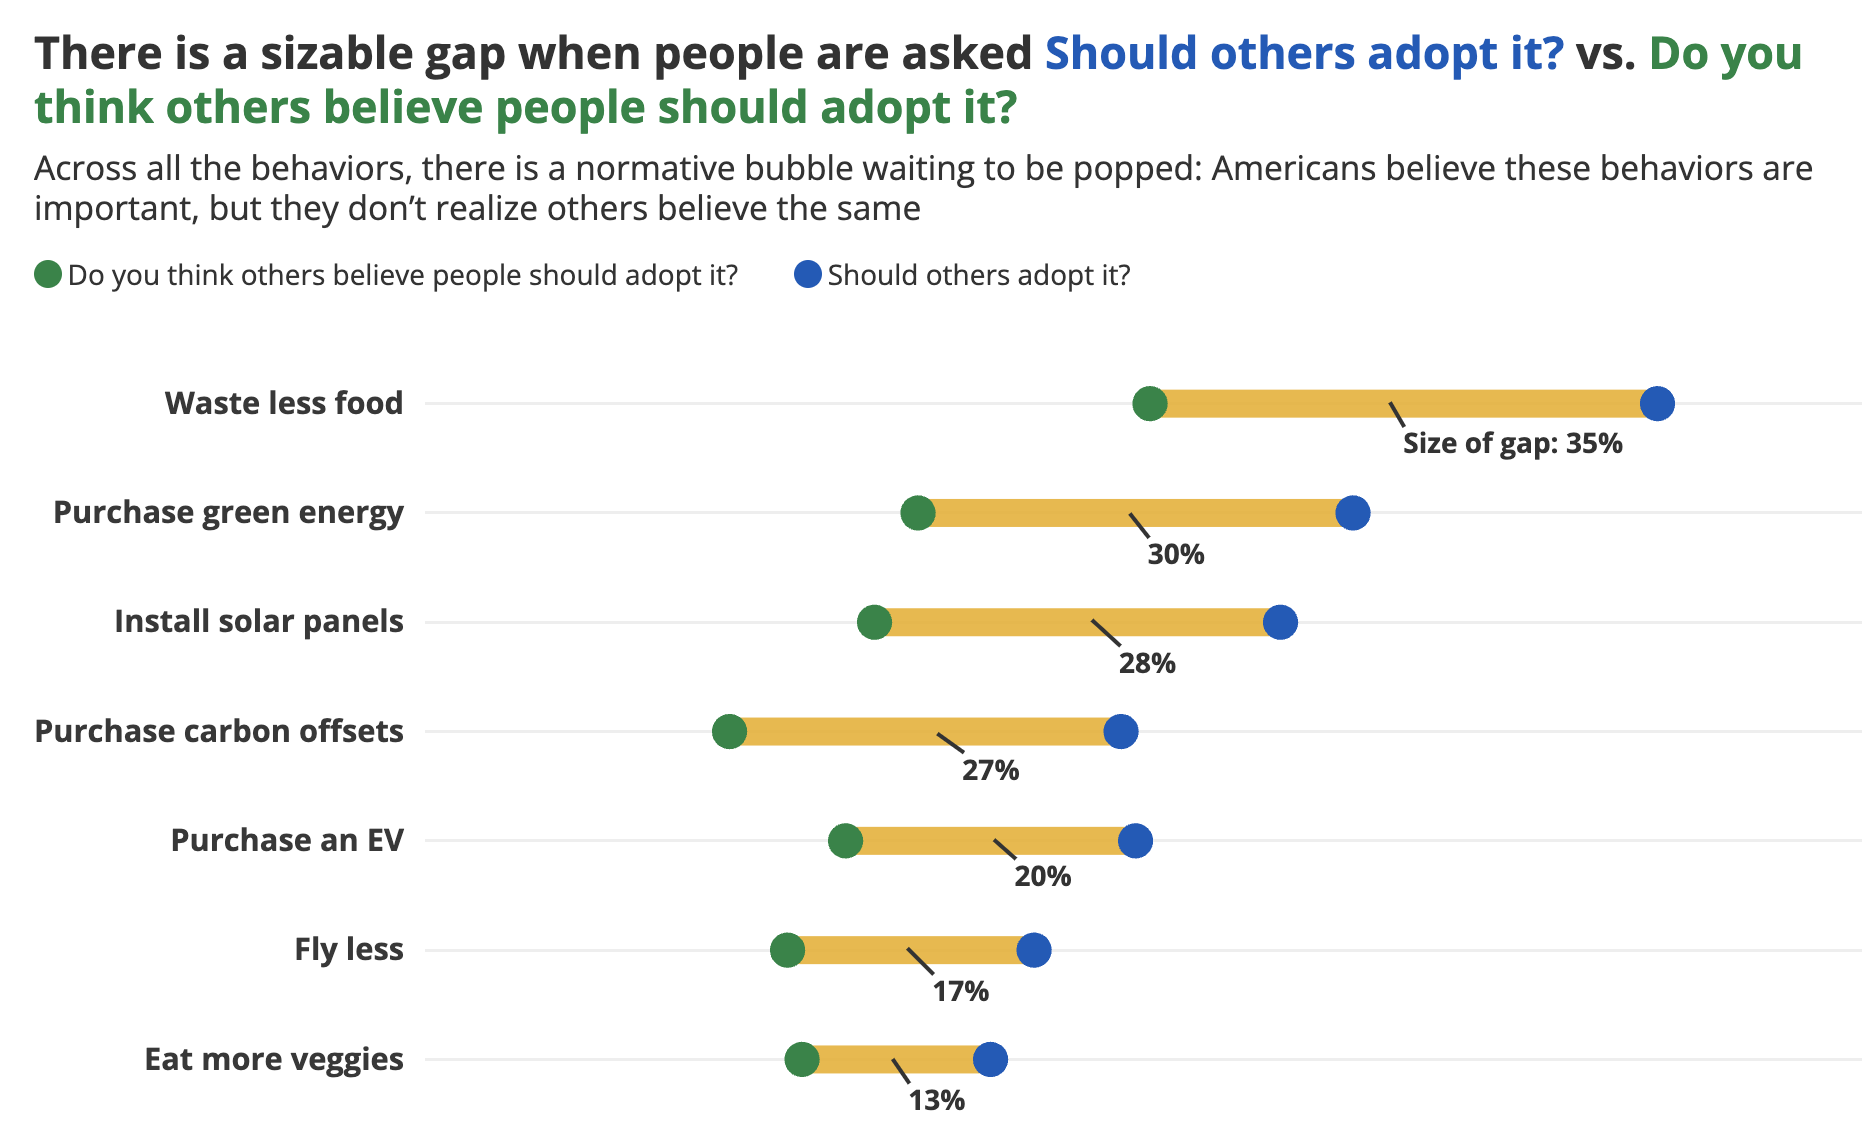
The Rare study asked questions about 7 behaviors: waste less food, purchase green energy, install solar panels, purchase carbon offsets, purchase an electric vehicle, fly less, and eat more veggies. The best predictor of climate action is whether a person believes that other people are already taking action on one of these behaviors. However, a large perception gap exists between what people think themselves, and what they believe other people are thinking. The first visualization shows this gap for the seven behaviors:

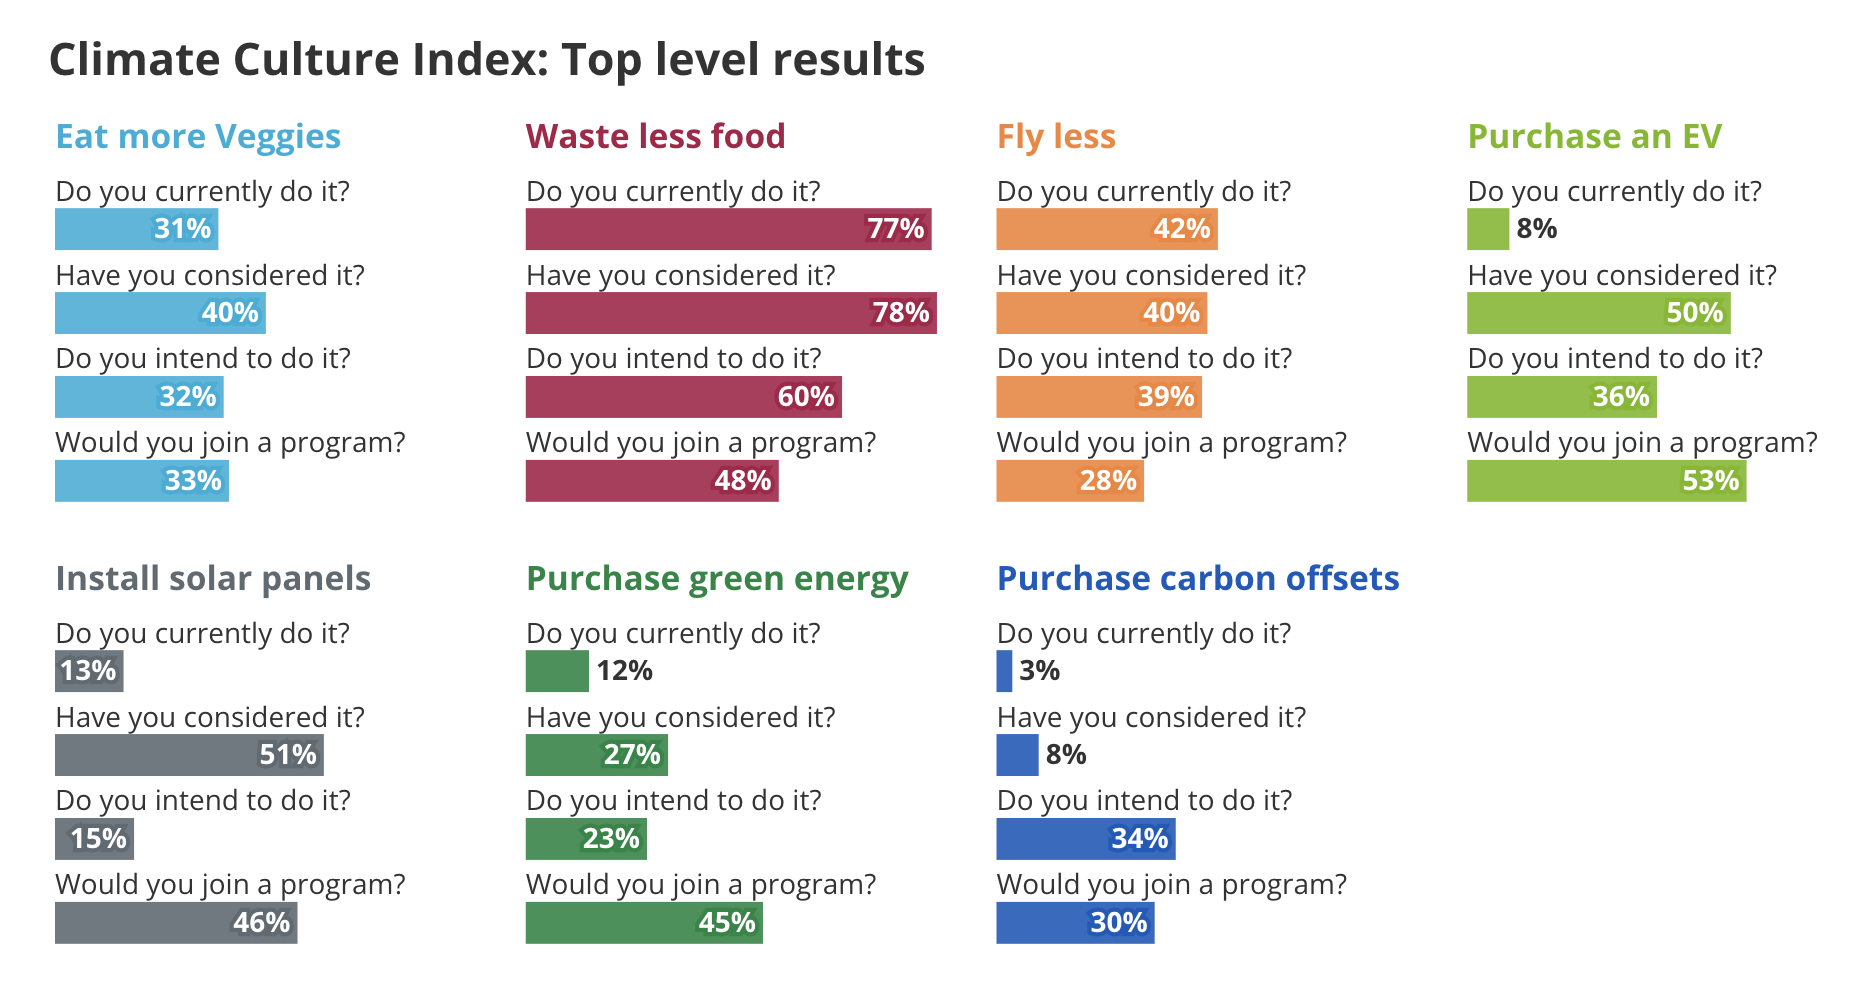
We also produced a chart showing the full survey questions asked for each behavior. For example, when asked about wasting less food (i.e. eat less meat), a broad majority think everyone should do it, and attempt to reduce their own food waste. Rare created dedicated pages for each of these behavior specific charts, to contextualize the results.

While simple charts, they clearly and powerfully communicate the important findings of Rare’s novel study. Using tools like Flourish allows us to move quickly and nimbly to produce production ready charts for projects like this.

Interested in working on a project like this?