State of Conservation Technology Report

WildLABs / 2021 / Environment & Climate Change

A clickable card display designed for WILDlabs, as part of their Technology of Conservation report. Each card shows the characteristics of a different type of technology

Overview

Graphicacy helped WILDLABS visually develop their first formal report on how conservationists utilize technology. The digital-first report highlights key insights from their research with innovate charts and graphs.

Background & Challenge

As the first online global community dedicated to conservation technology, WILDLABS is at the forefront of a revolution in the conservation space, and is a central hub for wildlife experts, engineers, and developers worldwide. In 2020, WILDLABS set out to formally capture and report on the challenges, needs, successes, and developments defining conservation tech.

With its research in hand, WILDLABS connected with Graphicacy to make its data more accessible, digestible, and impactful. Graphicacy’s streamlined, easily digestible visualizations enabled WILDLABS’ State of Conservation Technology report to take the niche subject of conservation technology to a much wider audience.

A chart that Graphicacy designed for WILDlabs, as part of their Conservation Technology report

Opportunity & Solution

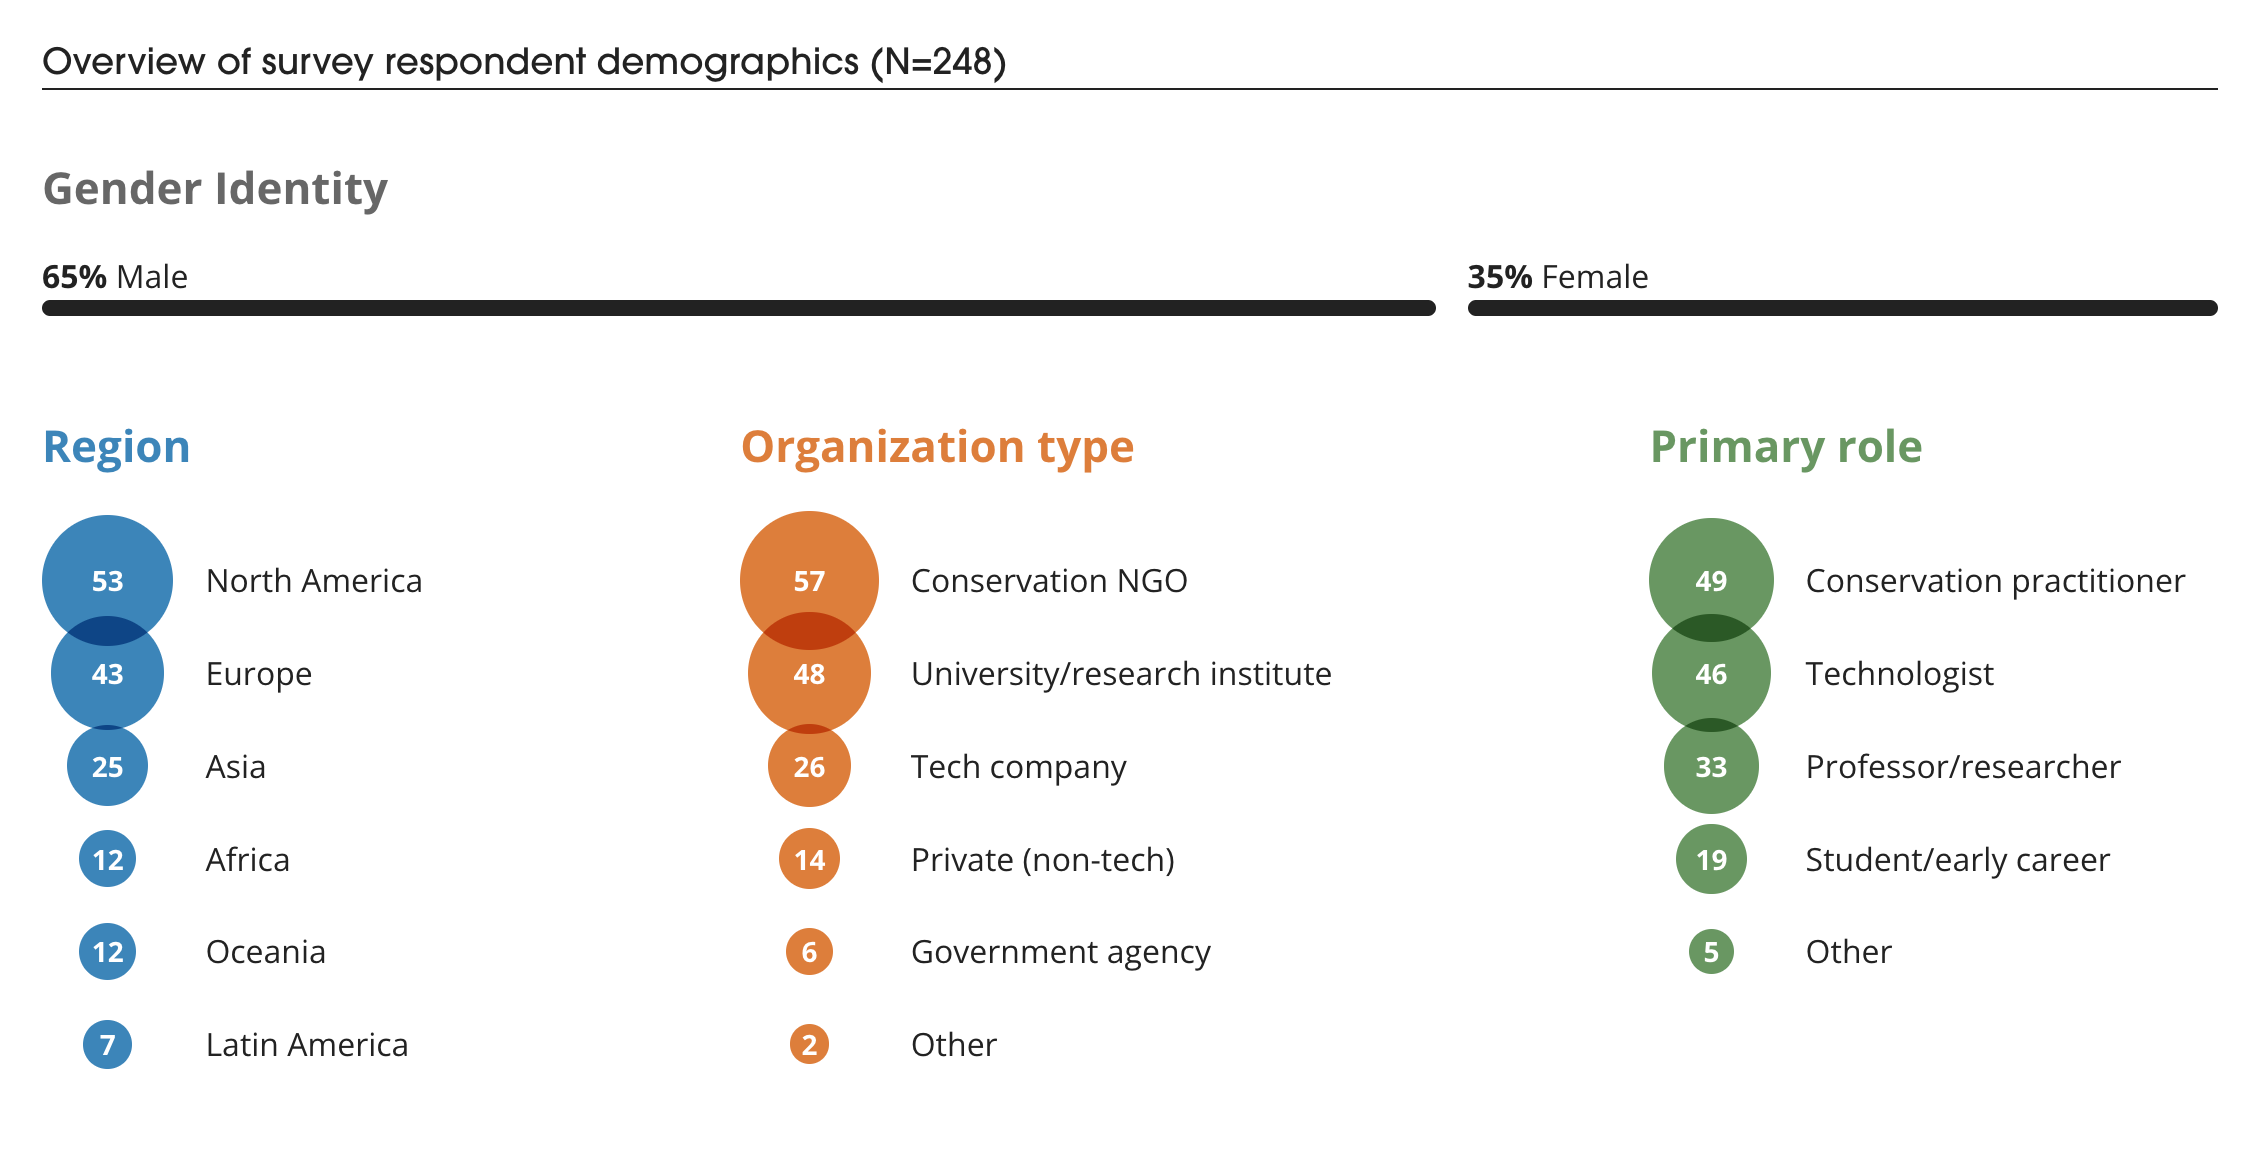
WILDLABS surveyed 248 respondents from 37 different countries, and held focus group discussions with leading experts across seven of the most widely used technology applications in the field. Initially, WILDLABS only planned to publish their findings in an academic publication, but they were inspired to think bigger after seeing other industries publish their own annual “State of Technology” pieces in the popular press.

“We were really excited about the content of the research, but we knew academic publications weren’t the best avenue for connecting with the audience we wanted to reach,” said Talia Speaker, the research lead at WILDLABS and one of the report’s authors. “We wanted it to be accessible and exciting for people outside the academic community.”

For this project, Graphicacy sought a clean, straightforward approach that quickly communicates the core message and highlights the most important data from WILDLABS’ research. This strategy gave WILDLABS the best value based on their deadline and budget.

A chart that Graphicacy designed for WILDlabs, as part of their Conservation Technology report

“A lot of the value we got from Graphicacy was working out the vision of what we wanted the report to be. We’re very happy with the outcome and it’s something we’re excited to build on.”


Talia Speaker, Research Lead at WILDLABs

Interested in working on a project like this?