Actions to Transform Food Systems Under Climate Change Report

CGIAR / 2020 / Environment & Climate Change

A spread designed for a print report for CGIAR

Overview

Graphicacy designed and laid out a print report and accompanying infographics and visualizations for a CGIAR report on how to transform food systems to avert a food and climate crisis.

Background & Challenge

CGIAR’s Research Program on Climate Change, Agriculture and Food Security (CCAFS) identified high-priority actions that we must collectively take now to create sustainable, inclusive, healthy and climate-resilient food systems by 2030.

The Graphicacy team was presented with the challenge of making the report — and the important data and content within it — easily digestible for readers through the use charts, graphs and infographics that elevate the key elements of the report. We were also responsible for the overall design of the print report.

Opportunity & Solution

We started working with CCAFS when the report was in the drafting stage. At that time, the graphics in the report were a mix of new diagrams concepted by the authors, and charts or maps cited from other sources. All had to be recreated to bring them in line with the visual style and color palette we established for the report.

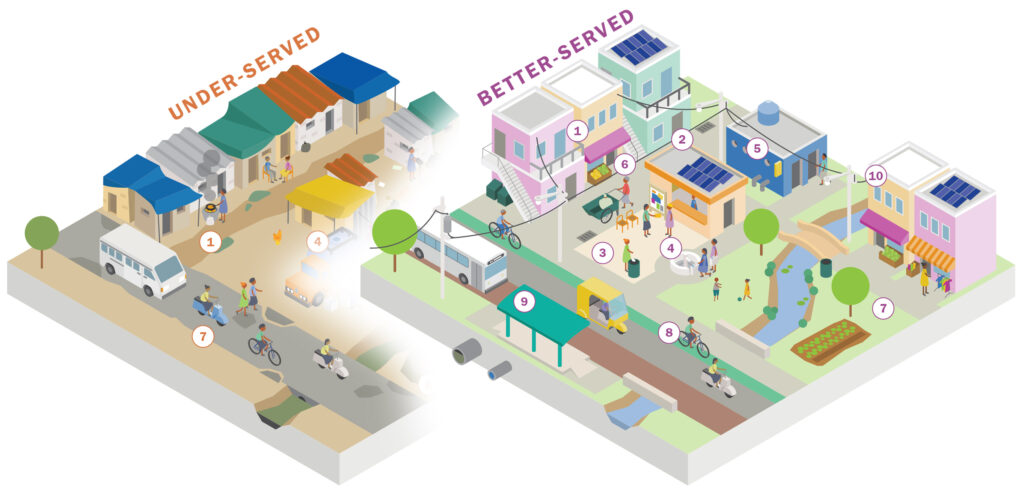
For the original diagrams and flowcharts created for this report, we worked collaboratively to offer improvements on visual structure, language, and design to ensure the core narrative came through clearly.

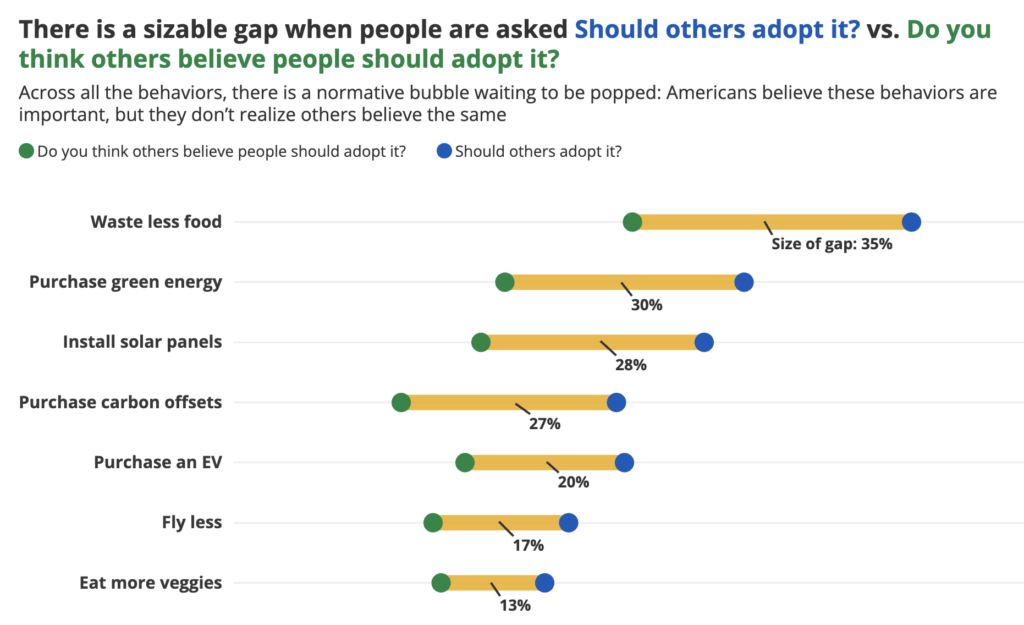
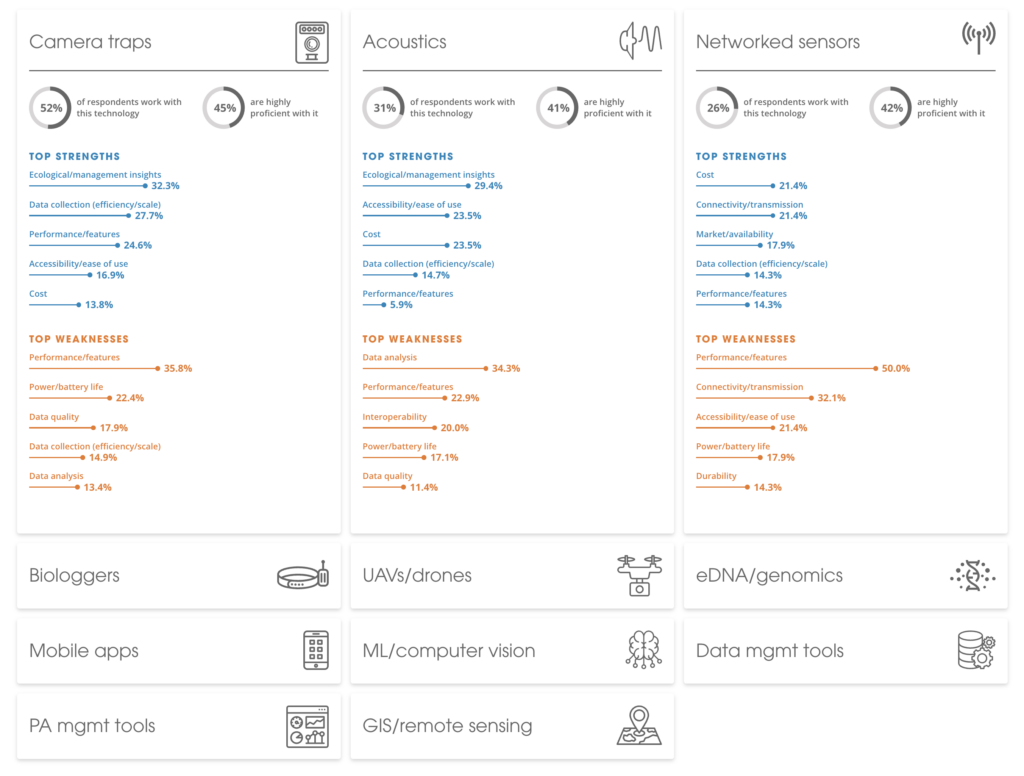
We also redesigned charts and graphs that were cited from previously published sources. For these charts, we brought fresh visual thinking to each, and made sure the data visualization method made sense for what the chart was trying to teach the reader. In some cases, we proposed brand new chart types. In others, we introduced annotation and more thoughtful use of color so each chart can tell a story.

Interested in working on a project like this?