Illustrating a Call to Action for More Equitable and Sustainable Cities

World Resources Institute / 2020 / Environment & Climate Change

Illustrations produced by Graphicacy for World Resources Institute, for their Seven Transformations for More Equitable and Sustainable Cities report. The illustrations shows a before and after image of the same block. The left scene is titled “Under-served”, and shows a slum with no access to indoor plumbing, no clean water, no public transport. The right scene is titled “Better Served”, and shows the same scene upgraded without displacing residents, with access to clean water, public transport.

Overview

Graphicacy produced the key visuals, in both print and interactive formats, for World Resources Institute’s marquee report on sustainable cities.

Background & Challenge

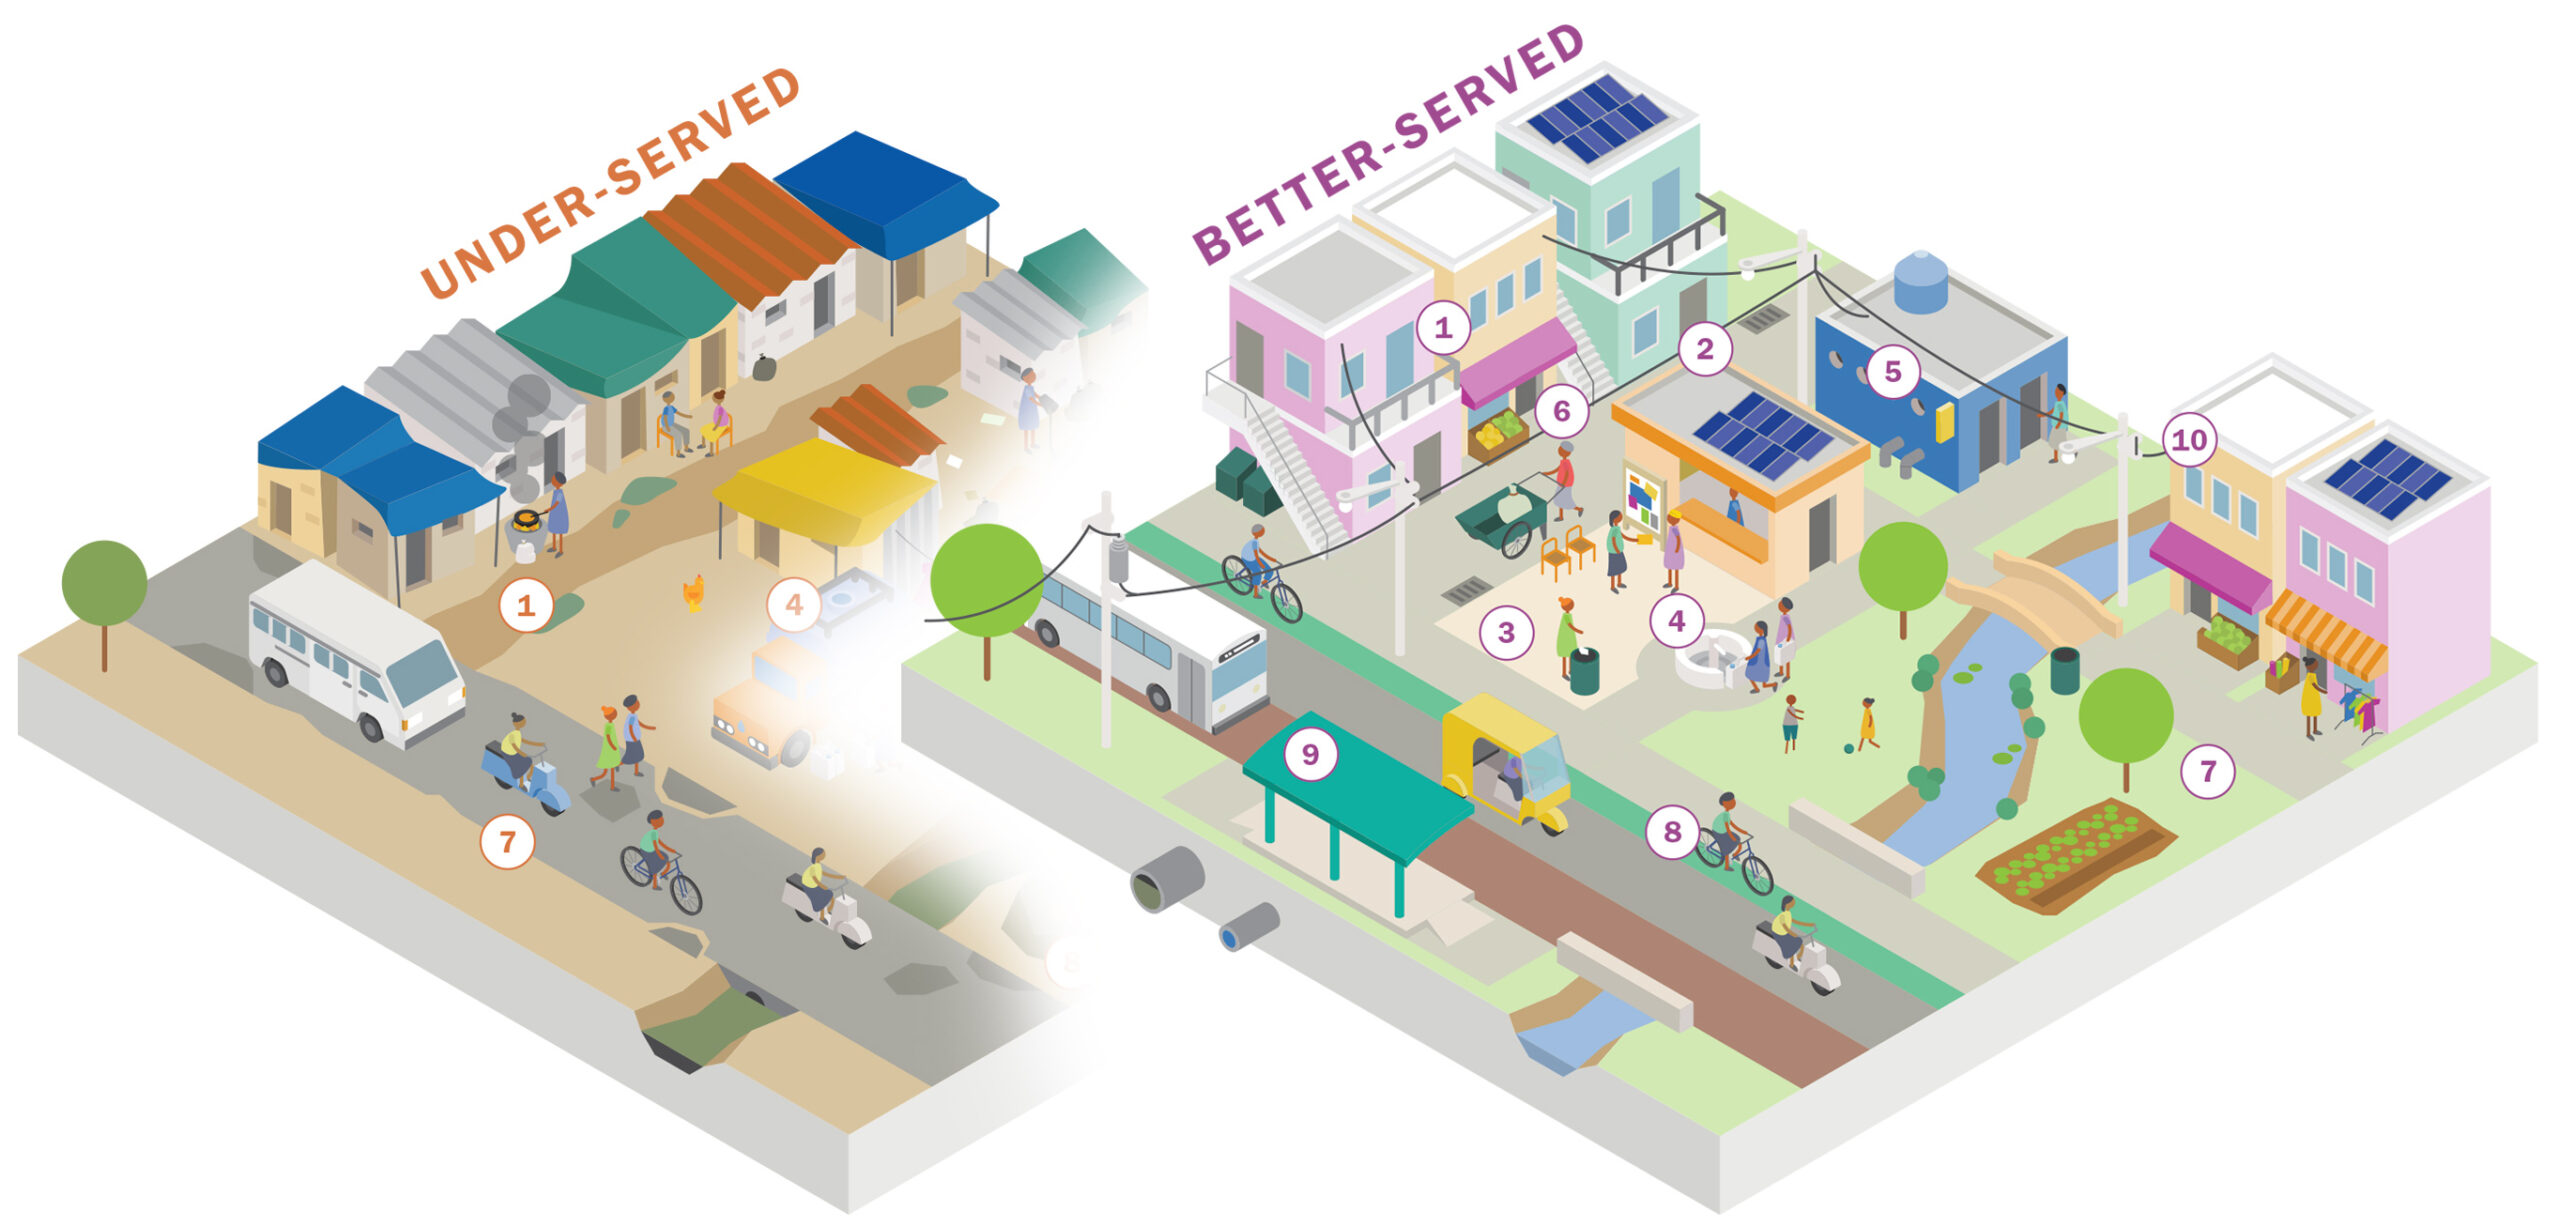
Each day, services that make modern life possible are easily taken for granted. A stable electrical current keeps the temperature comfortable in your home. The unlimited supply of tap water flowing into your home is invaluable for hygiene, hydration, and meal preparation. Your own personal vehicle or proximity to public transit gives you access to jobs and opportunities. These services are not the norm for those living in the global South. More than 1.2 billion people — or one in every three urban-dwellers on the planet — lack daily access to essential urban services. The massive worldwide urban services divide creates a dangerous and unjust burden on underserved individuals, damages the environment, and holds back the potential of whole cities and nations.

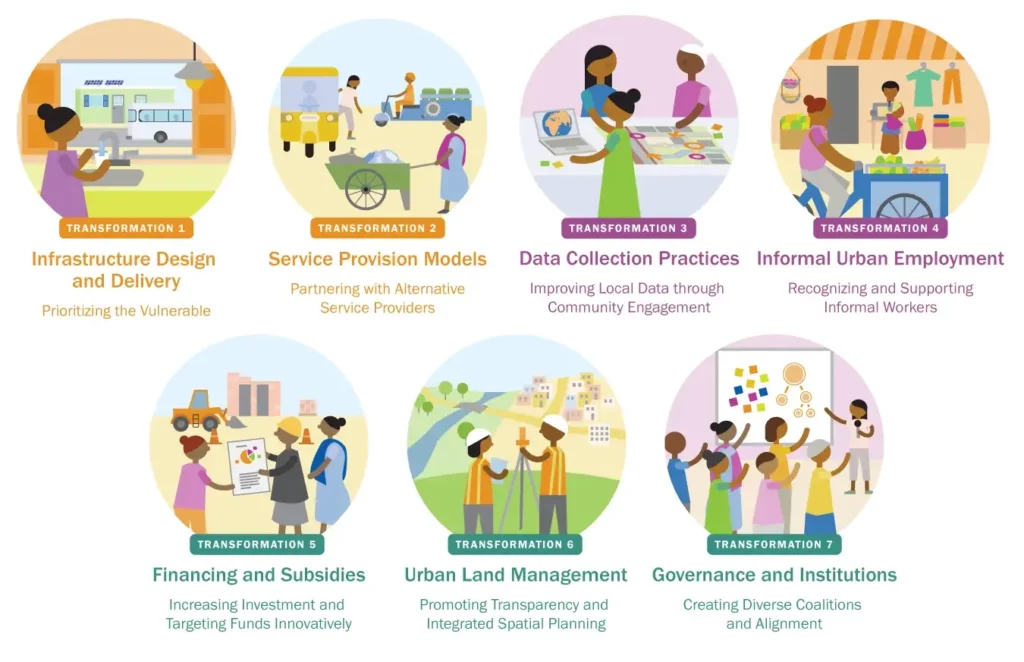
To help close this gap, the World Resources Institute’s (WRI) Ross Center for Sustainable Cities produced a report titled Seven Transformations for More Equitable and Sustainable Cities, which paints a picture of the urban services divide and presents strategies for global cities to deliver equitable access to urban services.

WRI entrusted Graphicacy with the monumental task of applying a visual context to the myriad problems and potential solutions around the urban services divide. Across a multi-month project timeline, Graphicacy developed informational graphics and interactive scrollytelling passages to help policymakers and other stakeholders understand the magnitude of the problems and why solving them must be a priority.

Opportunity & Solution

Graphicacy and WRI worked together at first in-person and then virtually during the pandemic to ensure the visualizations did justice to both the research findings and the complex layers contributing to the inequities. Designing a graph that depicted the urban services divide was the first step. Graphicacy then developed a scrollytelling narrative to explain the graph and put it into context.

Other scrollytelling elements illustrate the benefits of upgrading informal settlements to improve living conditions and environmental sustainability. The graphic evolves to show how a series of progressive improvements can have large and lasting impacts. Graphicacy partnered with illustrator Ben Oldenburg to bring this graphic to life, with an isometric style city scene. Ben also helped produce vignettes for all seven recommended transformations.

Illustrated vignetted for the Seven Transformations needed to improve cities: 1) Infrastructure Design and Delivery, 2) Service Provision Models, 3) Data Collection Practices, 4) Informal Urban Employment, 5) Financing and Subsidies, 6) Urban Land Management, 7) Governance and Institutions

WRI leveraged the visualizations to explain concepts of urban inequity in the online version of their report as well as the 224-page printed version. The communications team at WRI used them as part of an integrated marketing campaign to expand the reach of their message across numerous social media channels.

“If you can illustrate what it looks like to go through life in the city without access to water or transportation, then you bring that idea to life. By following the story of one person's experience, you can see how the burdens are handed down from generation to generation. We wanted to convey the weight of the burden in graphics to demonstrate the severity of the urban services divide.”


Anjali Mahendra, Director of global research at WRI’s Ross Center for Sustainable Cities.

Interested in working on a project like this?