To tell this powerful story, Everytown worked with Graphicacy and technology and marketing experts at Allegiance Group to create impactful visualizations in an integrated scroll-triggered narrative, that drive the key points home and offer actionable pathways for change.
As the project’s design consultants and data visualization experts, Graphicacy had a clear mission: Find an innovative way of using the data to tell the story more tightly through the integration of key data points integrated with the narrative.
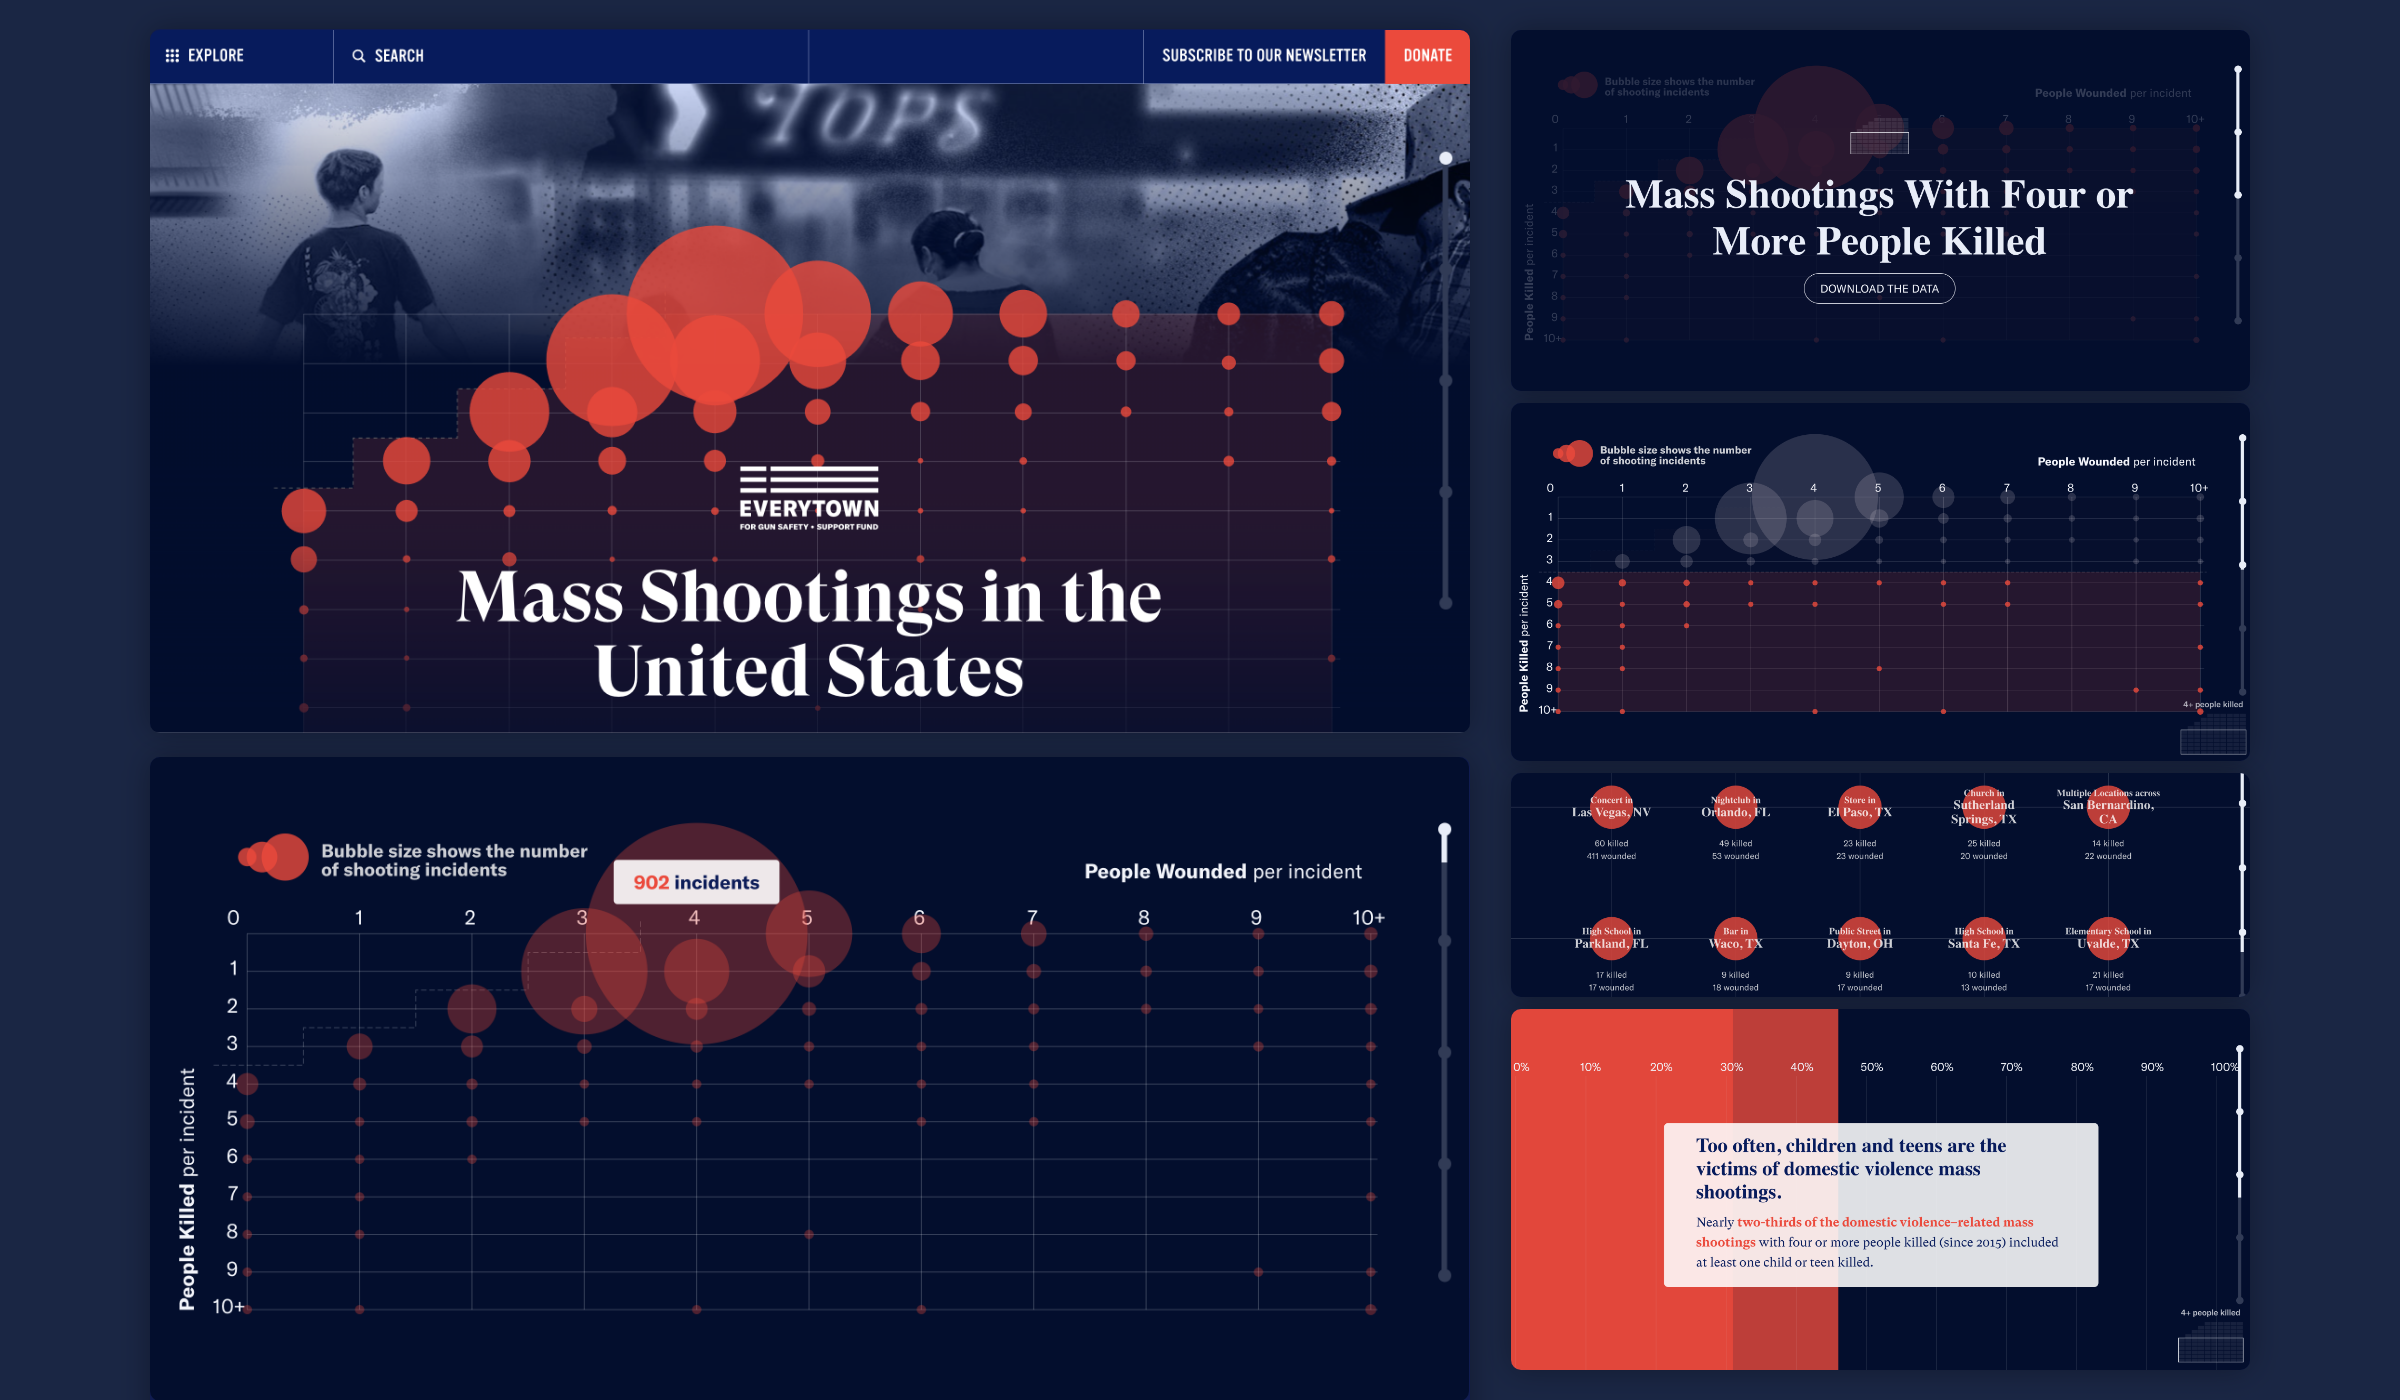
The Graphicacy team created dynamic scrollytelling, using cards of text that appear at crucial points in the data story to provide context around the new mass shooting definitions and numbers, while the charts animation and transition in the background. For increased engagement, each card includes social sharing options when a user selects the text.
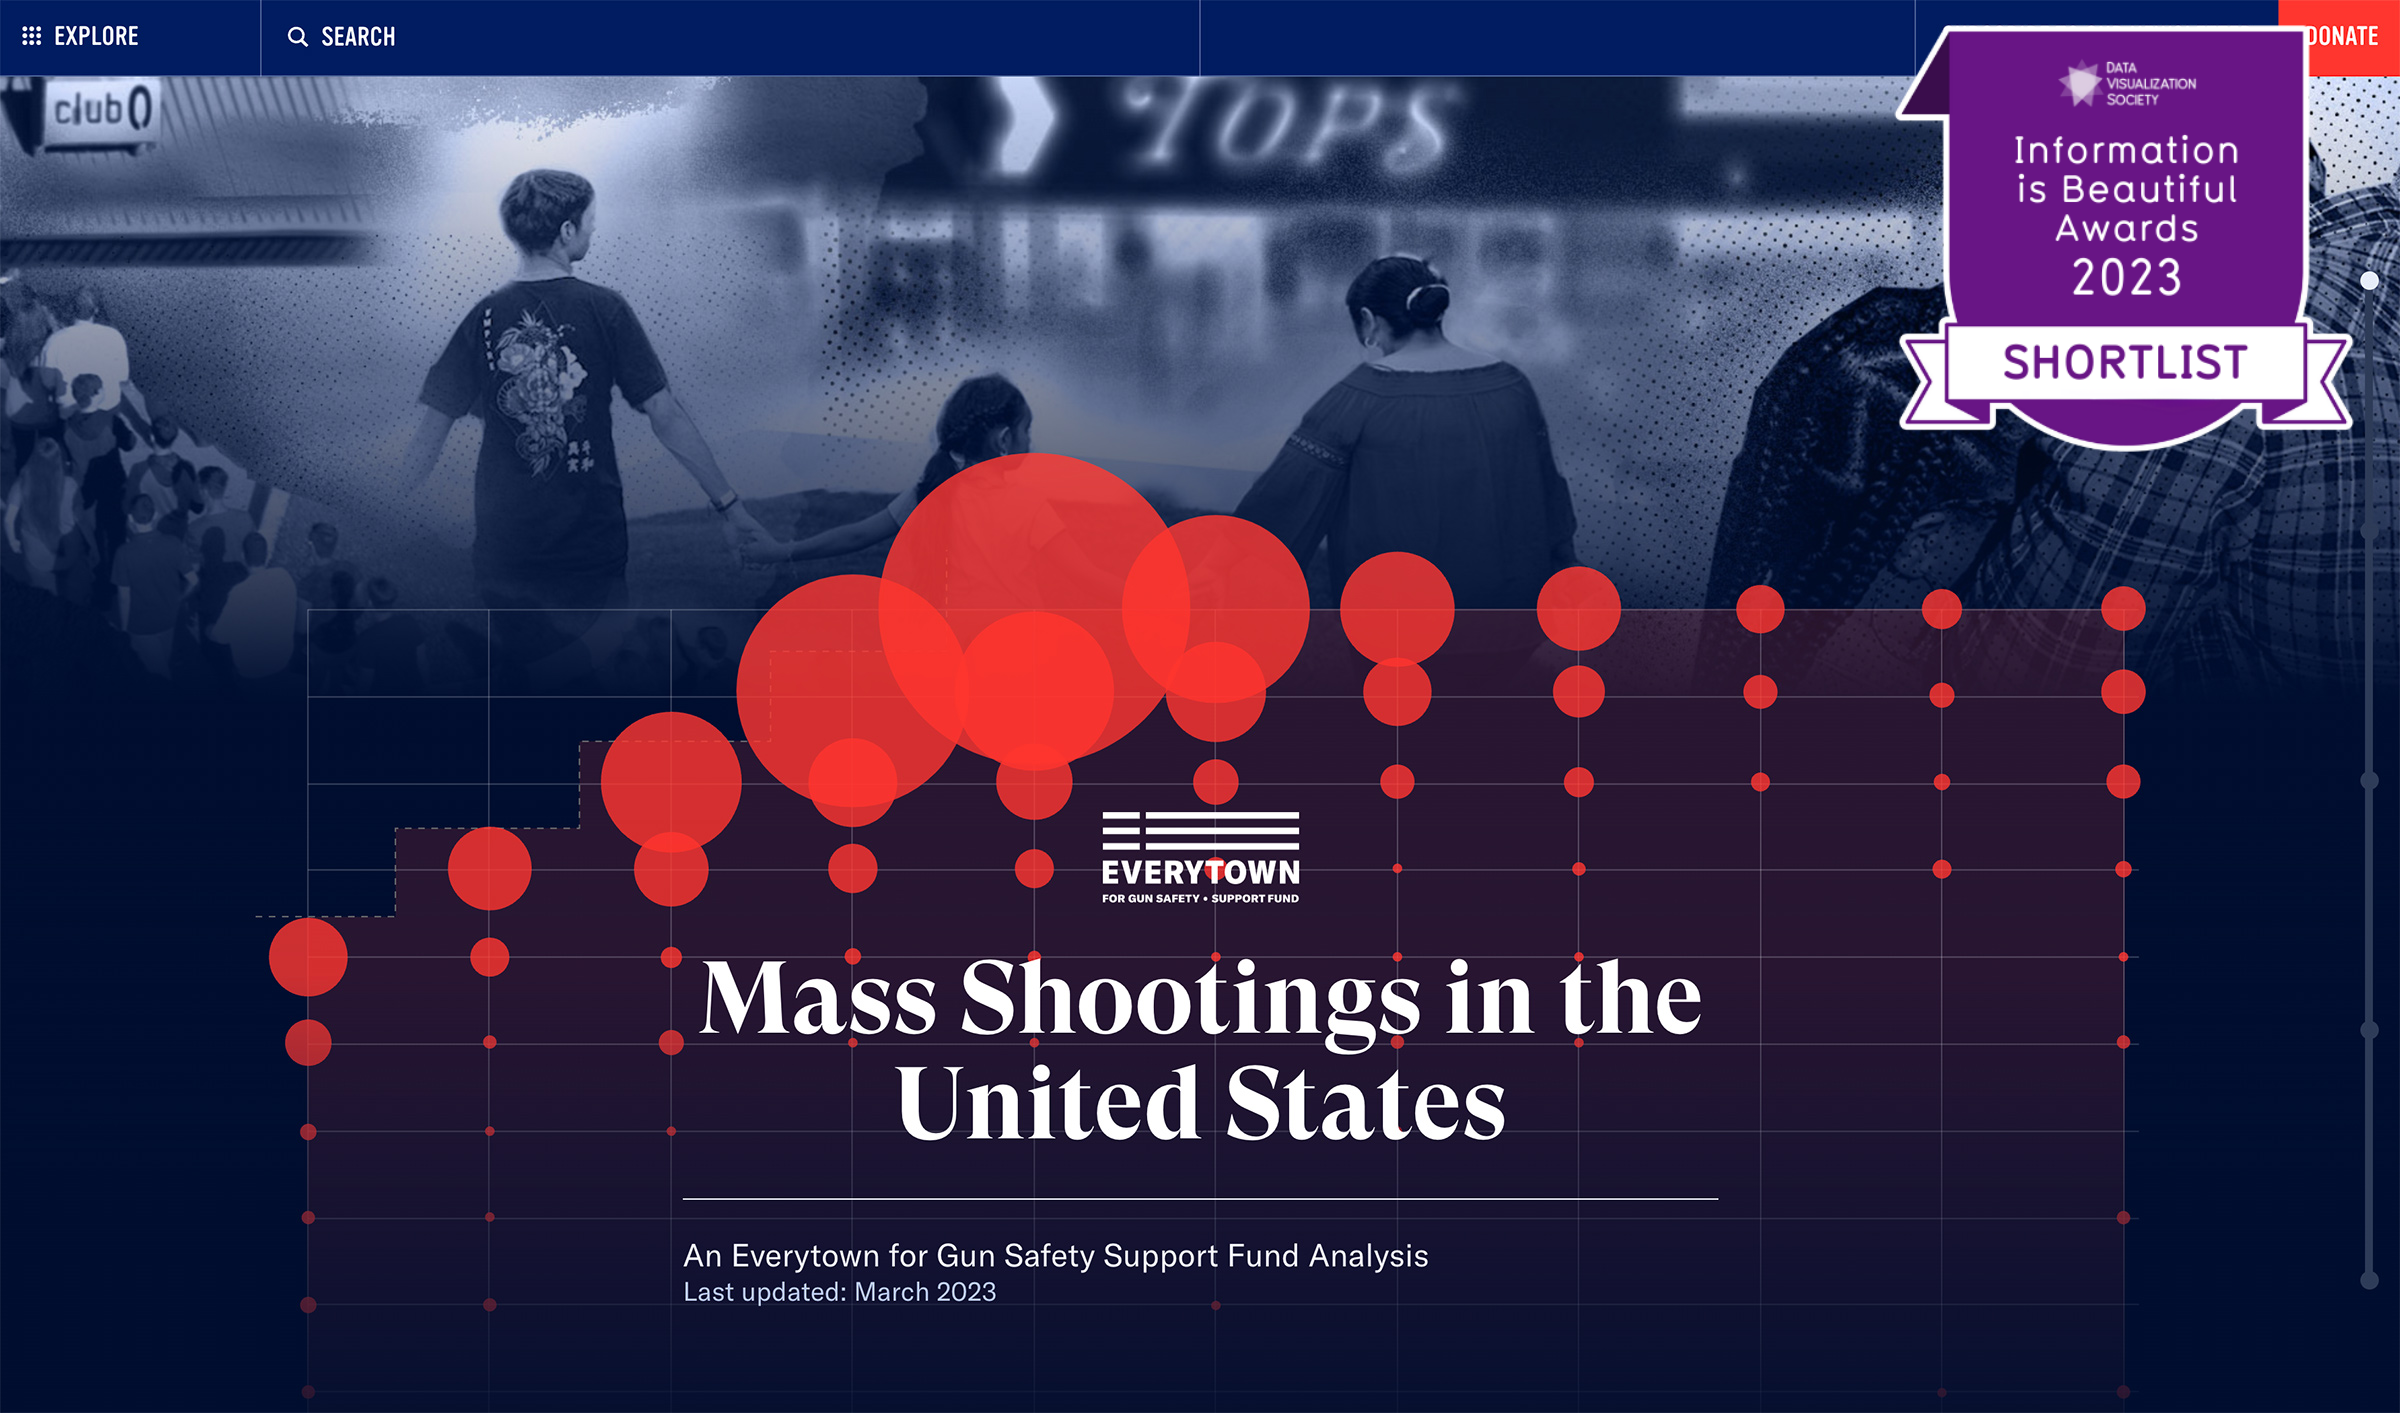
The graphs themselves include a striking visual element: vivid red bubble shapes that expand with the number of incidents.
The story moves from mass shootings with fewer than four people killed to those with more than four people killed, then to the 10 deadliest mass shootings. In between, blue solution cards appear that drive home proven ways to prevent more shootings, with research to back them up. These include:
- Background checks
- Extreme risk laws
- Limiting access to assault weapons and high-capacity magazines
- Passing Disarm Hate legislation
For maximum clarity, Graphicacy’s visualization experts developed the key findings and solutions as “story points” — much like storyboarding in motion graphics or filmmaking.
The script went through plenty of iterations. By simulating transitions using design software, the Graphicacy team was able to get buy-in from Everytown and Allegiance before any lines of code were written.
Allegiance Group built the report in WordPress and React, allowing Everytown to fully control the content and data displayed on the report.