As in previous years, the AA3 survey results showcase the unmet demand for, and benefits of, afterschool programs in a data-driven way while identifying which children and families are missing out.
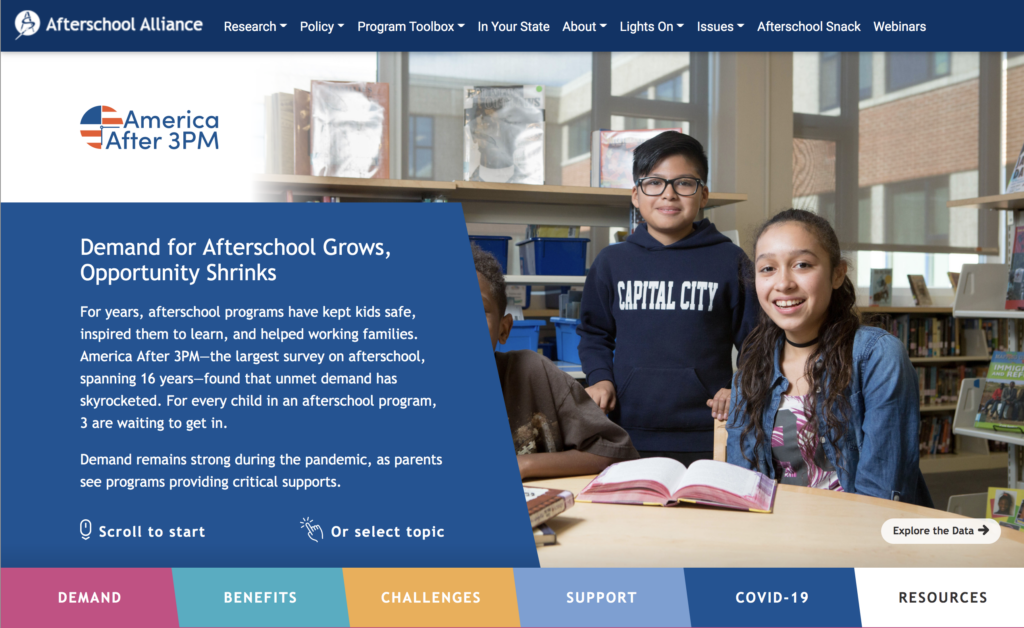
The new AA3 site weaves together three components: A condensed landing page that displays top-line summary data, a robust data explorer and a collection of downloadable assets and shareable graphics. The rebuild enabled Graphicacy to approach the site with fresh perspectives based on five years of user feedback and the latest best practices in UX design.
For example, the new landing page retains the tab-style organization of data in four categories—Demand, Benefits, Challenges and Support. Each map visualization on the page leads users into the data explorer, which presents the survey’s rich underlying data at national, state and community levels. However, Graphicacy reduced the number of navigation layers and options so users reach their desired data in fewer clicks.
Graphicacy also made the hierarchy of information within each tab much more apparent. They moved related assets, such as fact sheets and reports, from sidebars to the primary data explorer view for heightened visibility. Users now have options to call up PDF summaries and export graphics for presentations and social media.
On the back end, Graphicacy integrated the data visualizations with the Alliance’s content management system. The new setup empowers Alliance staff to modify on-page content, add new assets, reconfigure graphics and much more, ensuring that this AA3 report offers fresh insights for years to come.