Improving an Extreme Weather Tracking Tool with API Automation

Union of Concerned Scientists / 2024 / Environment & Climate Change

Featured image for the Danger Season Tool - Data Automation & API Configuration. A project built by Graphicacy for Union of Concerned Scientists.

Overview

With their online Danger Season tool, the Union of Concerned Scientists (UCS) tracks extreme summer weather worsened by climate change across the United States. The goal: inspire urgent action for equitable climate solutions. In 2024, UCS engaged Graphicacy to streamline the tool’s backend development via a more efficient, automated, and user-friendly application programming interface (API).

Background and Challenge:

UCS built their Danger Season data visualization tool to draw attention to the scope, urgency, and variety of climate-linked extreme weather events across the U.S. each summer.

Danger Season visualizes counties currently under extreme weather alerts along with four key indicators updated daily, including the total number of people facing alerts and the percentage of people who faced at least one alert since Danger Season’s start in a given year.

The tool was effective, but also labor-intensive. It required daily data collection and processing by UCS Senior Social Scientist for Climate Vulnerability Juan Declet-Barreto. The reliance on manual interventions and ad hoc processes also made the tool hard to scale or change.

UCS turned to Graphicacy for help optimizing and streamlining Danger Season’s behind-the-scenes functionality. Specifically, Graphicacy engineered a backend API solution to automate the data preparation and data visualization work.

Opportunity and Solution:

To get an accurate sense of the current state, Graphicacy started with a rigorous requirements-gathering process. This included an assessment of the data in use, where it came from, who touched it, and the frequency of updates.

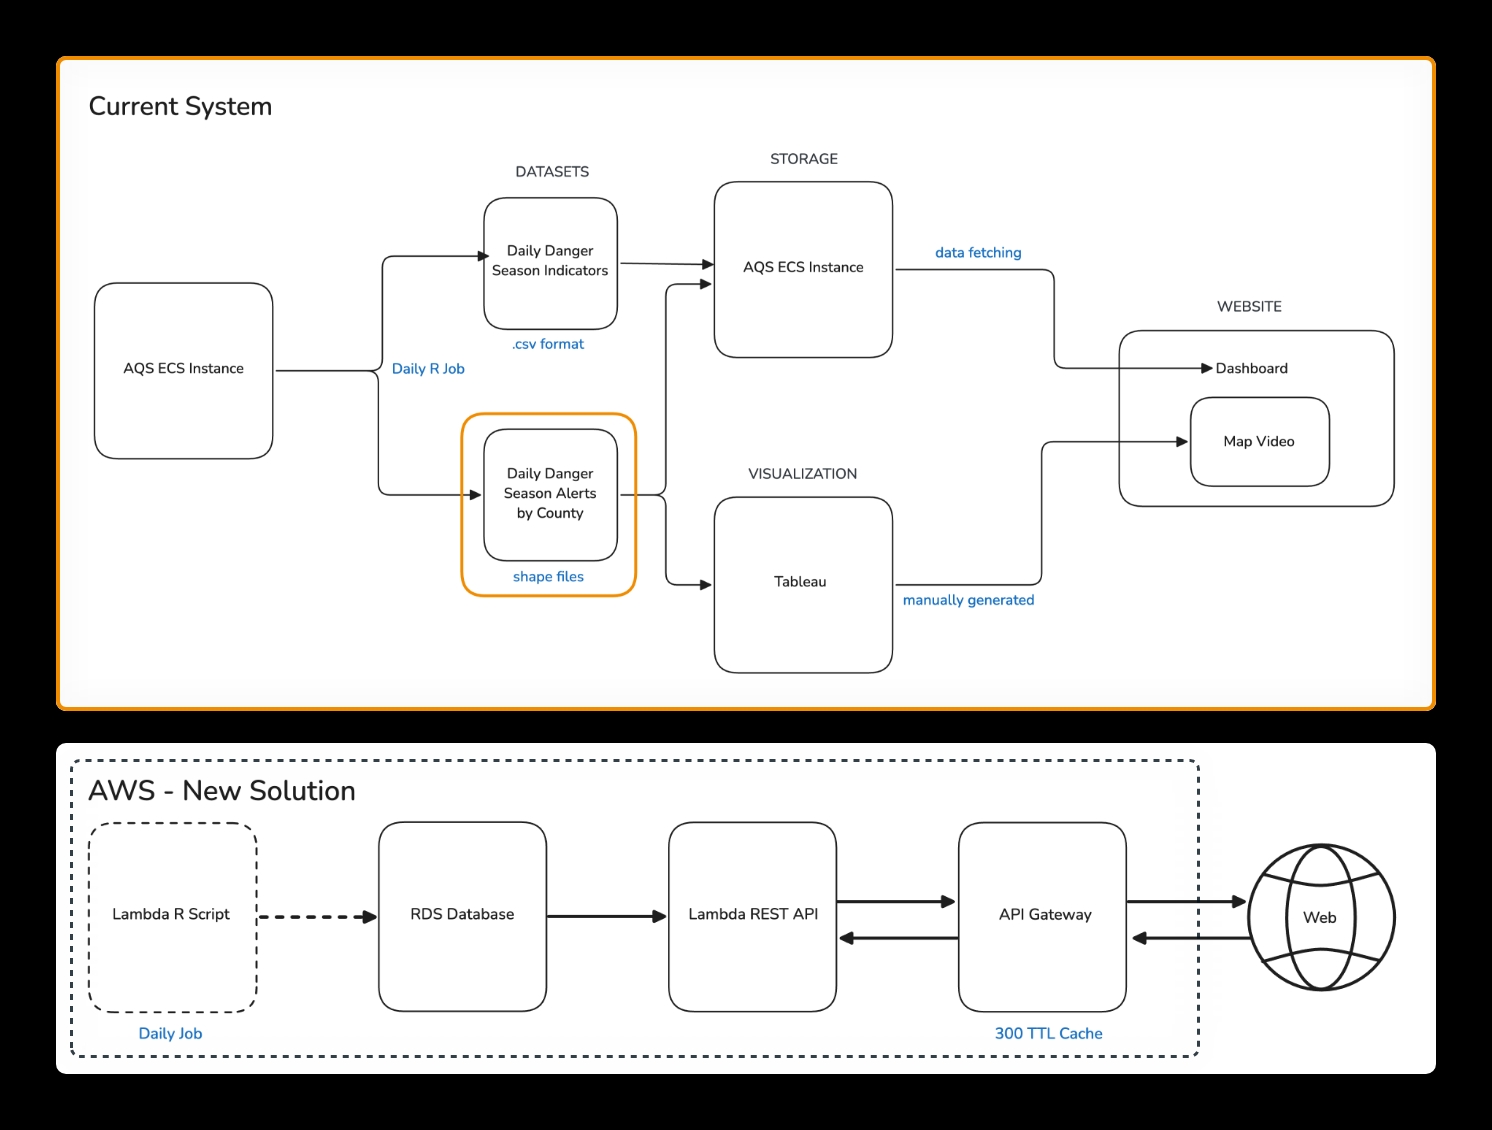
Graphicacy built the new API using programming languages familiar to Juan and his team, which allows for easier down-the-road tweaks and ongoing maintenance. They also included self-service options via Swagger UI so the scientists could add new data categories to scale the project and integrate additional indicators.

Juan and his team are already considering how best to take advantage of that flexibility. For example, they’re looking into collaborating with other UCS colleagues to assess the agricultural impact of weather events or add air quality index values to the map.

By automating Danger Season’s data ingestion and storage, Graphicacy has greatly reduced AWS infrastructure costs as well as the maintenance burden on UCS staff, who now have more time to focus on translating their data into powerful messages around urgent climate action.

A story in The Guardian noted that, by late June 2023, half of the U.S. population had experienced at least one Danger Season alert. And in August 2024, a story in the Los Angeles Times referenced the tool and UCS’s diligent work in a profile of the country’s Danger Season.

“I wanted to find a partner to fully optimize and automate both the daily data preparation and visualization processes through scripts. Now, through this new streamlined process, we only need it for a few minutes each day. Graphicacy helped cut our monthly cost for infrastructure by more than 50%.”


Juan Declet-Barreto, Senior Social Scientist for Climate Vulnerability

Interested in working on a project like this?