We See You: Visualizing the Afropunk Festival with Real-Time Data

Afropunk / 2019 / Racial Equity

Featured Image for Afropunk Festival designed by Graphicacy.

Overview

The Afropunk Festival team came to Graphicacy to visualize a demographic “snapshot” of attendees, for large and small format screens, using real-time survey data collected at their event locations around the world.

Background and Challenge:

The Afropunk Festival is an annual arts festival that features music, film, fashion, and art produced by alternative black artists. These events were created with a desire to be groundbreaking, push limits, challenge the status quo, forge future movements and celebrate the diverse expression of Black creativity and community worldwide.

In this spirit, and with a desire to better understand their audience, the Afropunk team designed a set of survey questions that would help them not only frame the demographic profiles of participants, but also the specific types of things they were most interested in at each location. Wanting to use this information in more “creative and different” ways, Afropunk asked the Graphicacy team to help them explore engaging visualization experiences that communicated the “We See You” message and underscored their engagement with, and investment in, attendees’ interests and desires.

Opportunity and Solution:

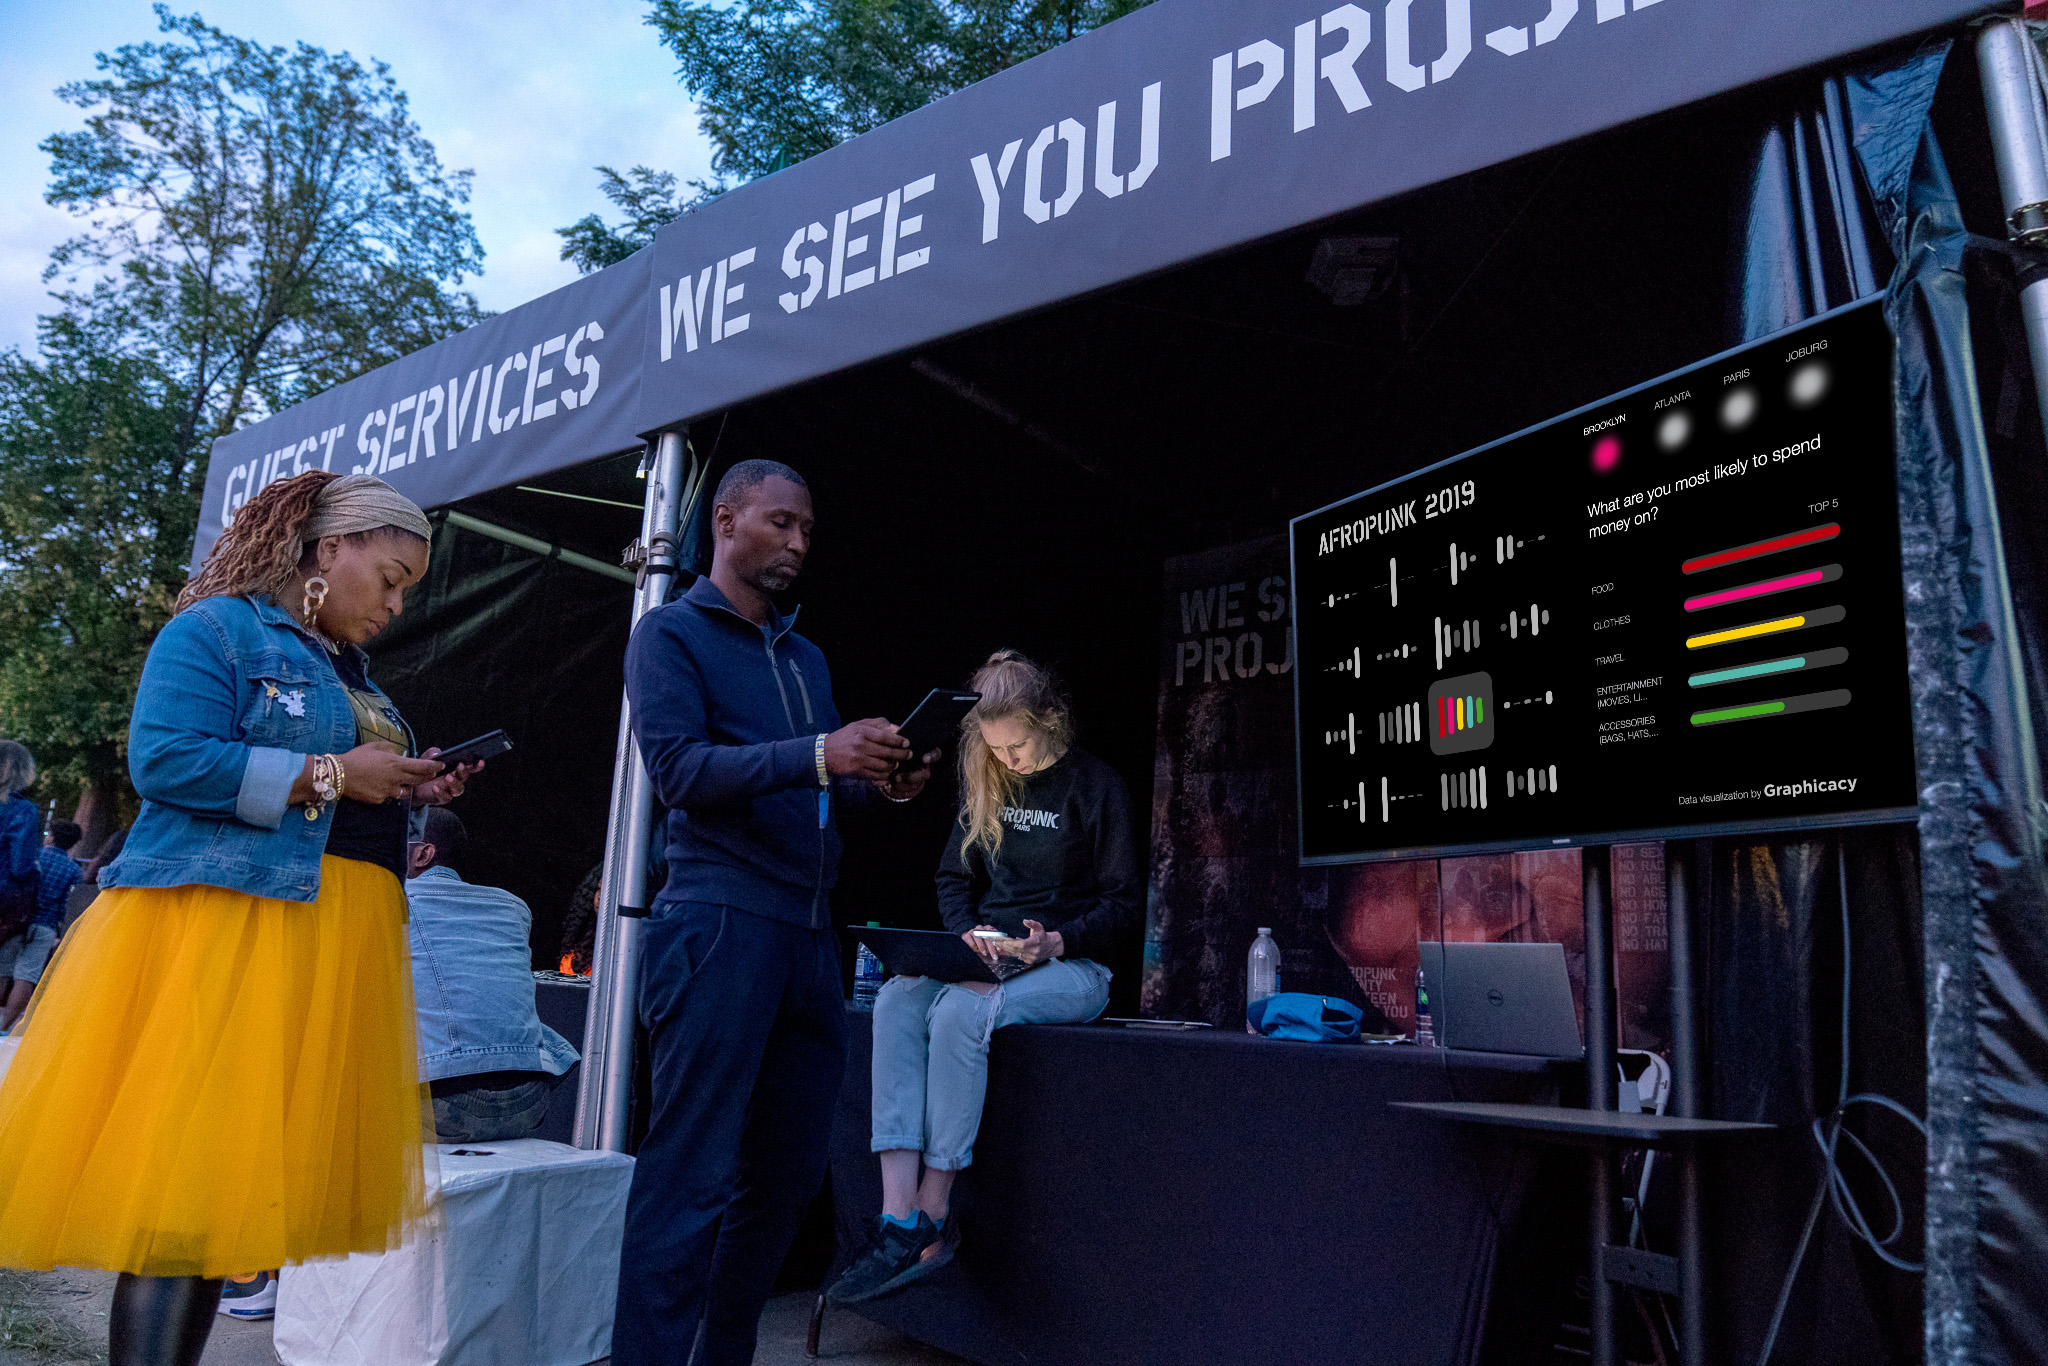
There was an opportunity in this project to not just simply visualize survey data, but also build a living, visual profile of each of the festivals as they progressed in real time for attendees. The Afropunk and Graphicacy teams devised a plan which had groups of trained volunteers engaging with the crowds at each location (Brooklyn, Atlanta, Paris, Johannesburg) to collect answers to these survey questions on digital tablets. The data collected was then frequently refreshed, via an API, and brought to life through engaging data visualizations on screens throughout the event grounds. The graphics helped people understand the similarities and differences between themselves and fellow attendees, both in terms of demographics and what motivated people to attend.

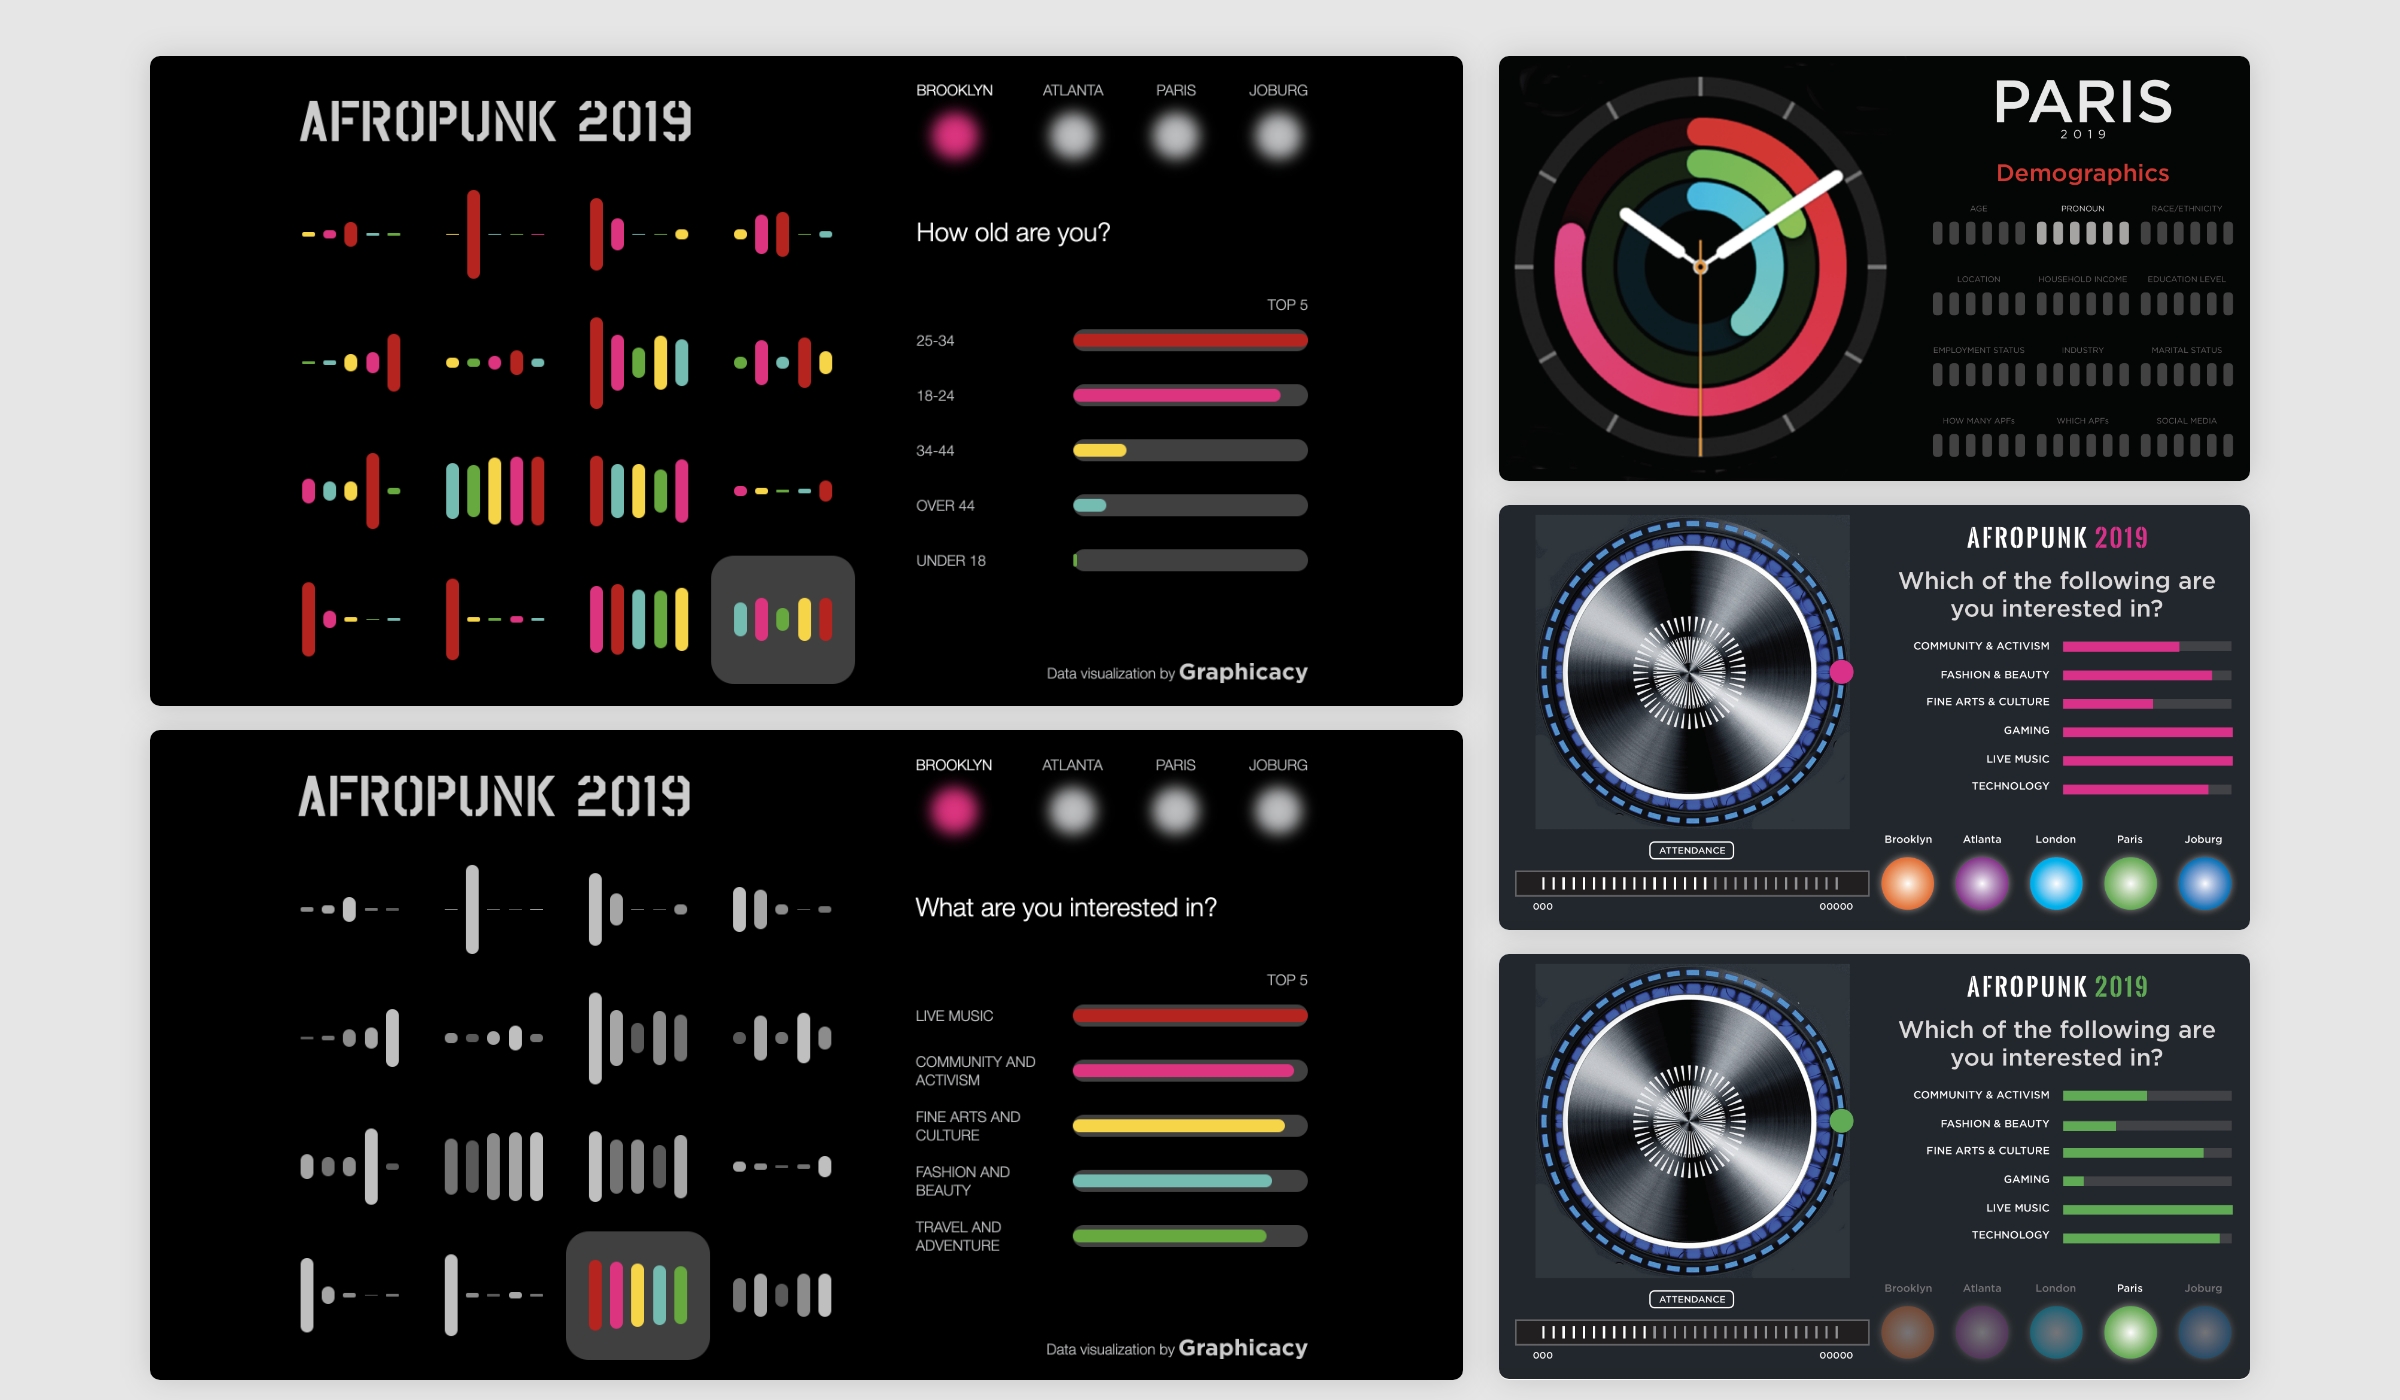
Graphicacy created a bold and colorful design that was in line with the Afropunk organization brand as a whole, as well as the aesthetic of the festivals that are a key part of their brand. Various visual approaches (see below) were explored in discovery and early design phases that played off the musical aspect of the festivals with imagery suggesting sound waves, volume displays and audio tech dials and discs. A lively, easy-to-read animation sequence, that periodically refreshed the grid of 16 data visualizations and highlighted survey questions, was built into the application to keep people interested and engaged.

Project montage of data visualizations for the Afropunk Festival, including early design and discovery explorations. Designed by Graphicacy.

“It was interesting that people would come and stand next to the graphic and look at it. The graphic provided pictures of the same group, letting folks know how similar –and– how diverse they are.”


Caroline Ettinger, (former) Senior Director for Data & Analytics, Afropunk

Interested in working on a project like this?