A One-Stop Resource for Global Vaccine Data

Johns Hopkins Bloomberg School of Public Health / 2019 / Global & Public Health

Main map view of the VIEW-hub platform, where the user can map a wide range of global Vaccine data

Overview

Graphicacy redesigned and reengineered the VIEW-hub data visualization platform for the International Vaccine Access Center (IVAC) at the Johns Hopkins Bloomberg School of Public Health to make it more engaging, intuitive and innovative.

Background and Challenge

In 2016, the International Vaccine Access Center (IVAC) at the Johns Hopkins Bloomberg School of Public Health introduced its revolutionary online platform, VIEW-hub, as a one-stop resource for global vaccine data.

This interactive, map-based platform allowed researchers, policymakers, public health officials, and program funders to call up data related to vaccine introduction and use, access, and coverage around the world.

The IVAC team saw tremendous potential for VIEW-hub to evolve into a more robust tool for users and administrators alike, but they recognized its limitations as time passed. IVAC selected data visualization experts Graphicacy to make the platform more engaging, more intuitive, and easier to update.

Vaccine data changes constantly. Nearly every month, somewhere in the world, a country introduces a new vaccine or changes which products it uses in its immunization programs. VIEW-hub, in its first incarnation, relied on developers to input all new data. Communication back and forth on updates could take days and adding new layers to VIEW-hub maps necessitated more delays. IVAC staff also spent long stretches scouring dense vaccine literature for new data and other relevant information to post to VIEW-hub users.

Opportunity and Solution

Short-term fixes would only take VIEW-hub so far. Graphicacy suggested targeting the root problems with a rebuild to enhance access, navigation, and management. Graphicacy’s designers and engineers immersed themselves in the world of vaccine data and IVAC’s operations to better understand their language, day-to-day processes, impediments, and end-user needs.

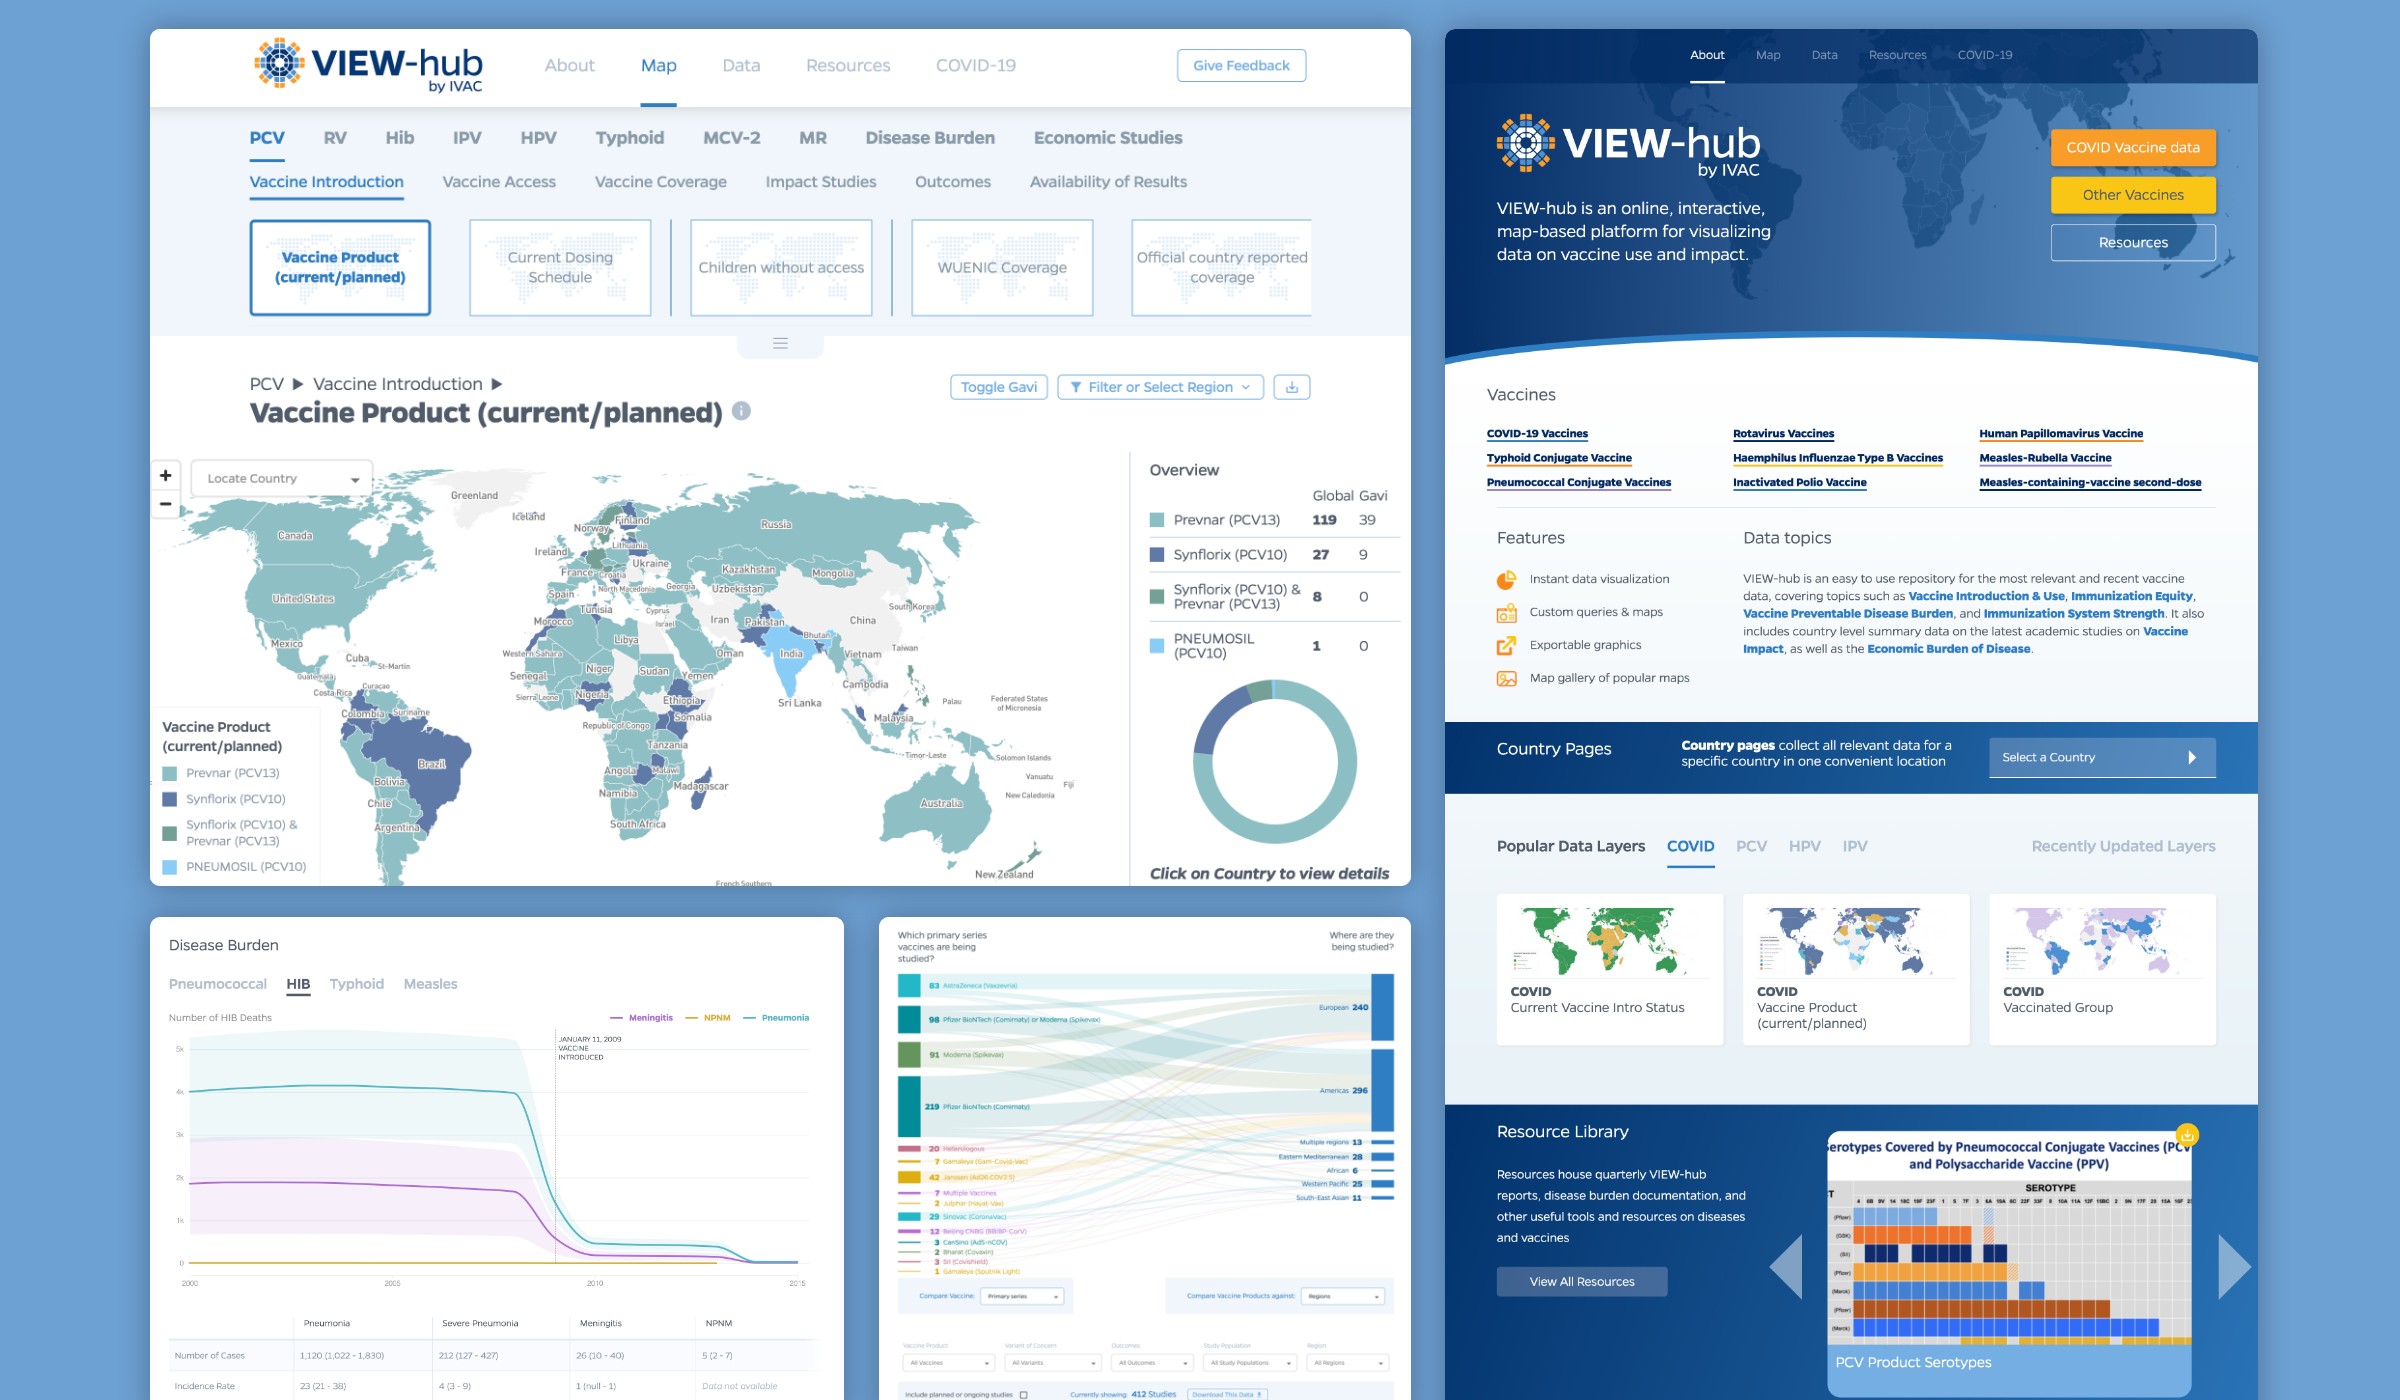
The entire platform was redesigned and rebuilt from the ground up, to empower the IVAC team to have more control over their own site, deciding which data gets displayed, how it gets displayed, and letting them do regular data updates themselves. This was done through the unique combination of Drupal, Airtable, Angular, and Mapbox technologies. Similarly, a total refresh of the user experience (UX) and interface design empowers the user to find the data they need more easily, share content quickly, and create high quality image exports of any view.

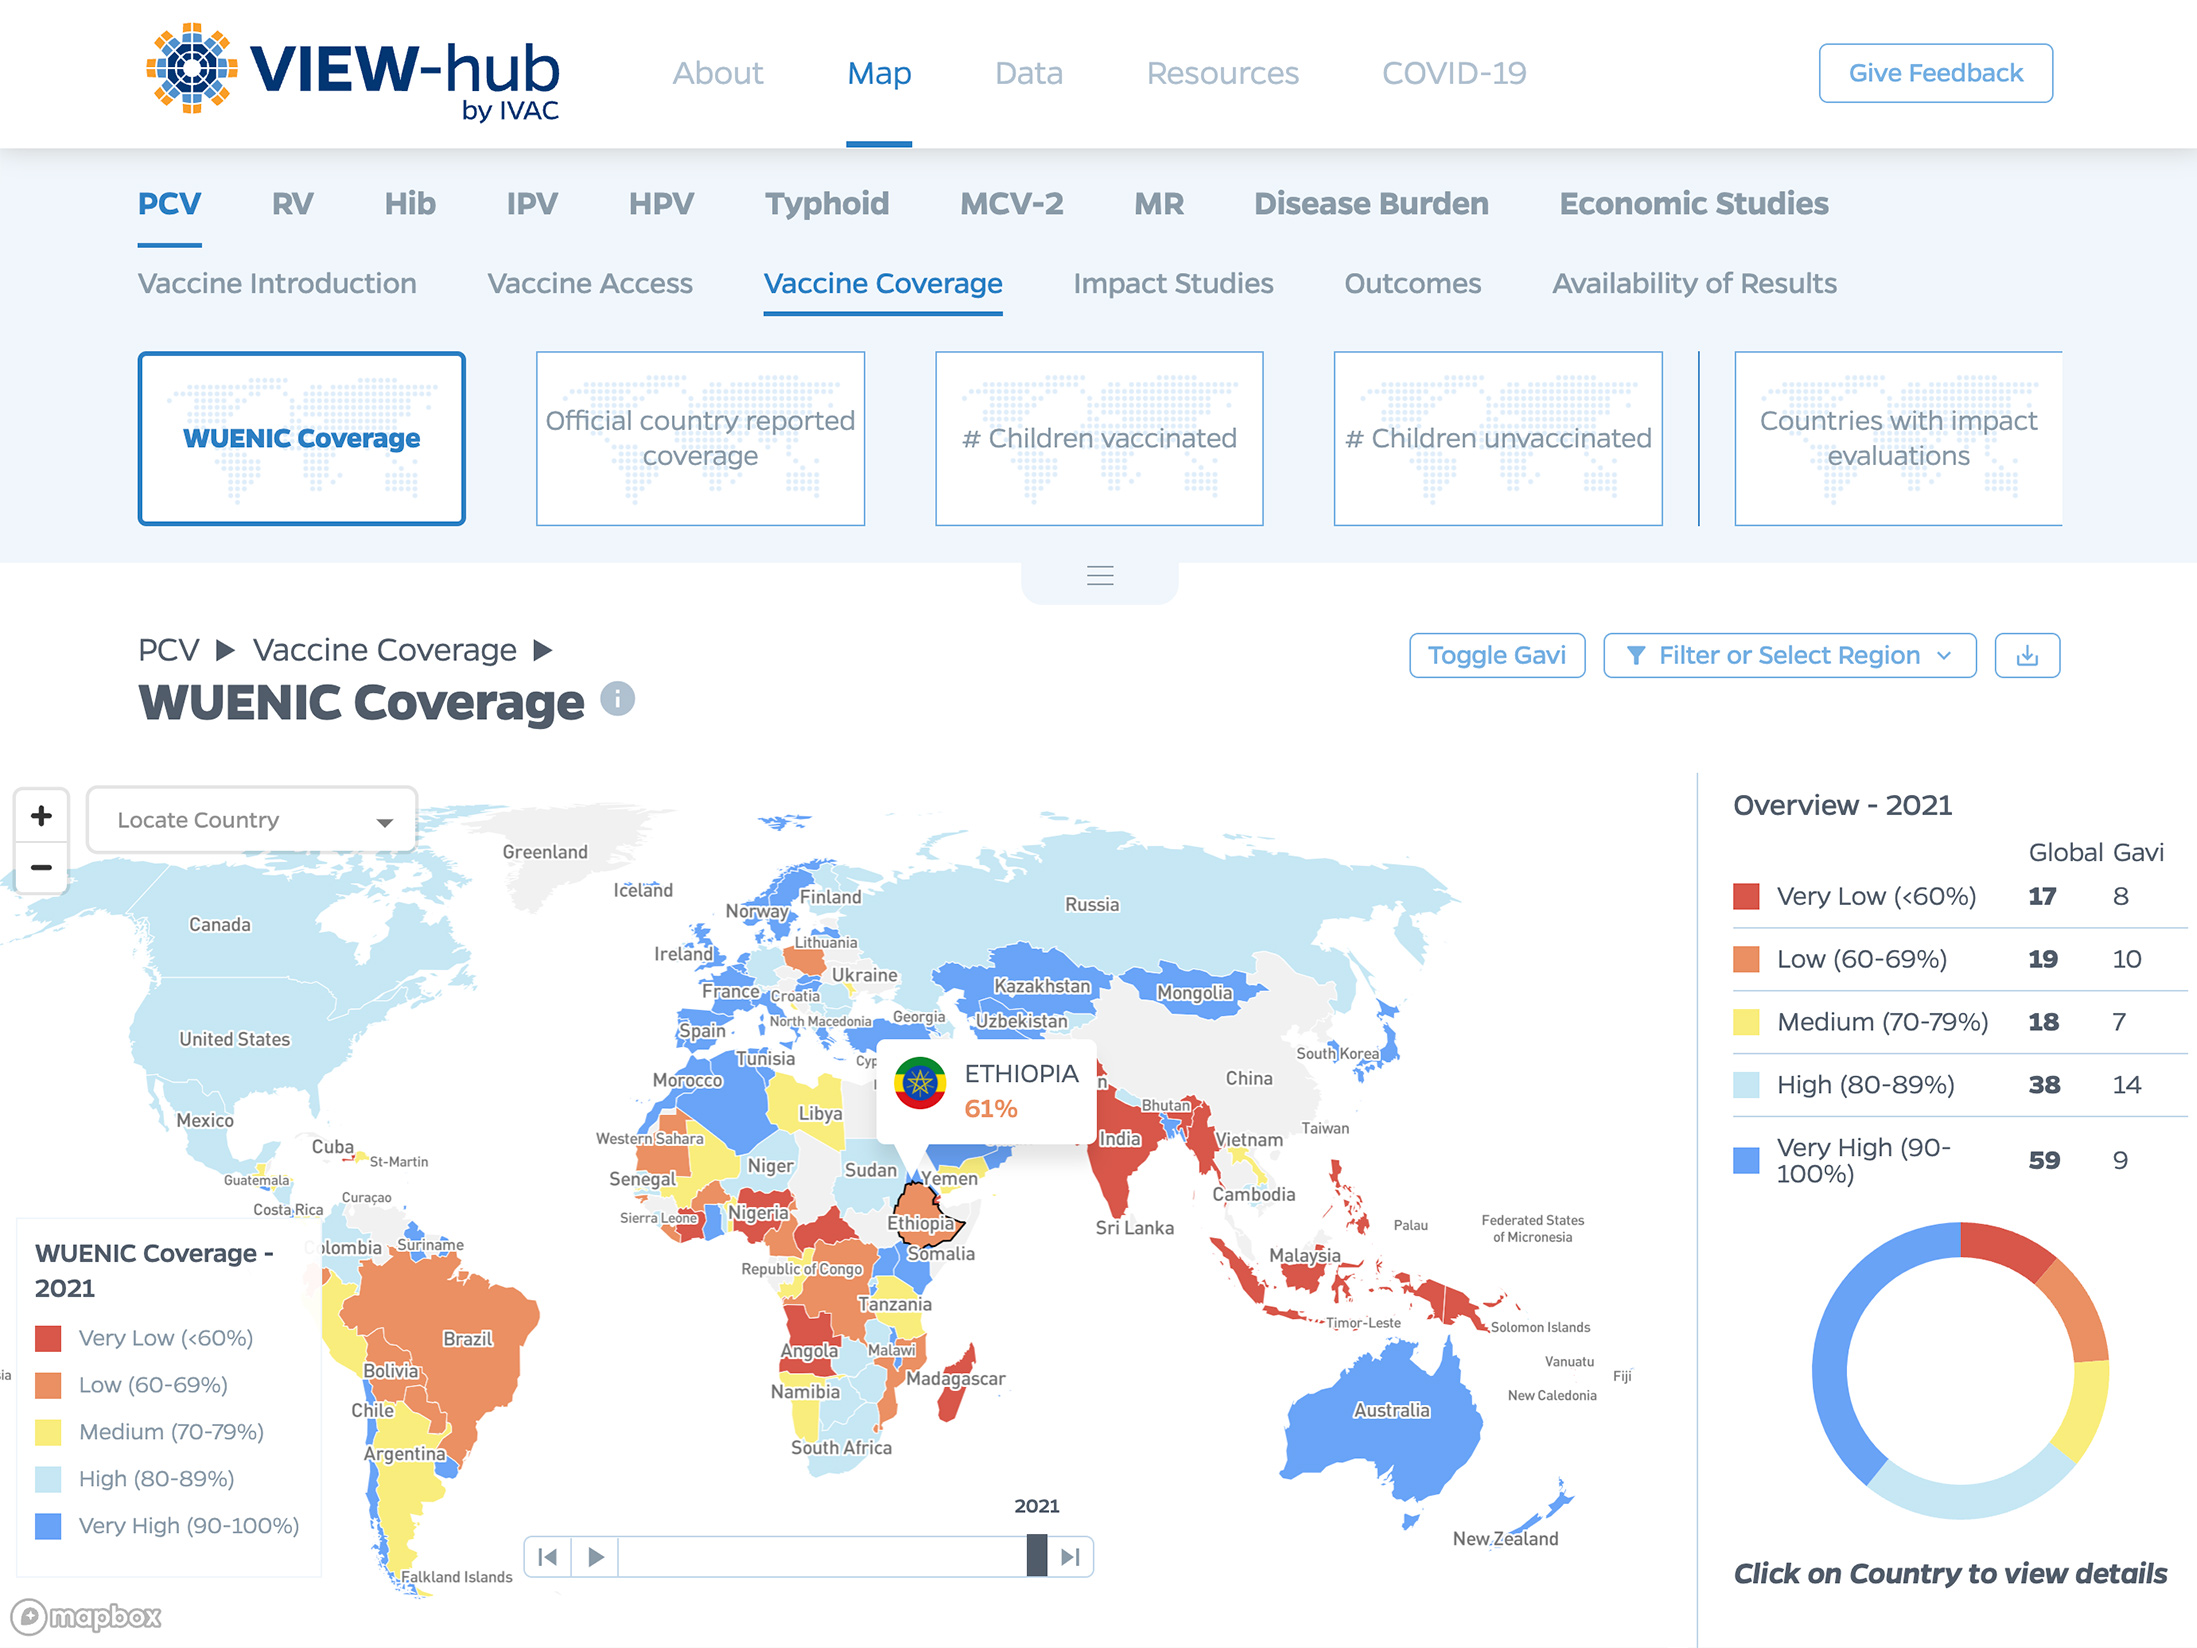
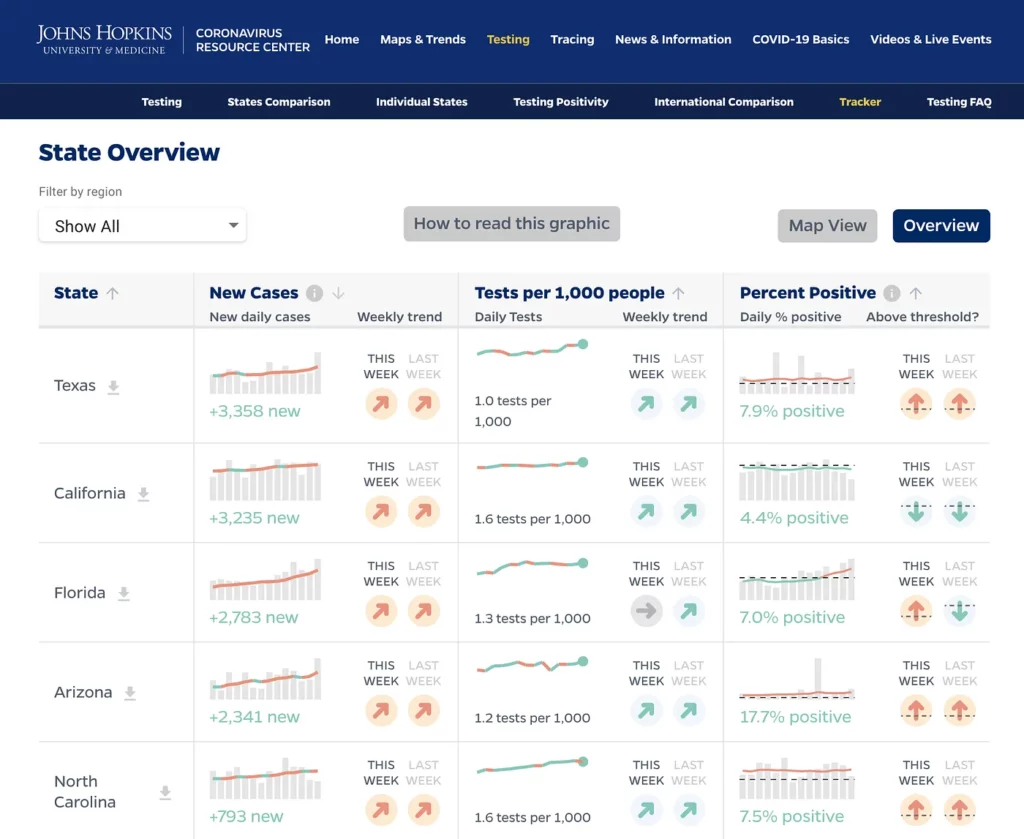
IVAC has realized its goal of creating a real-time, searchable, map-based visualization of global vaccine data. The fully interactive VIEW-hub platform now serves up current and historical data on several vaccines in plain terms across 113 different map layers — with the potential to easily add more, including vaccine data specific to adults.

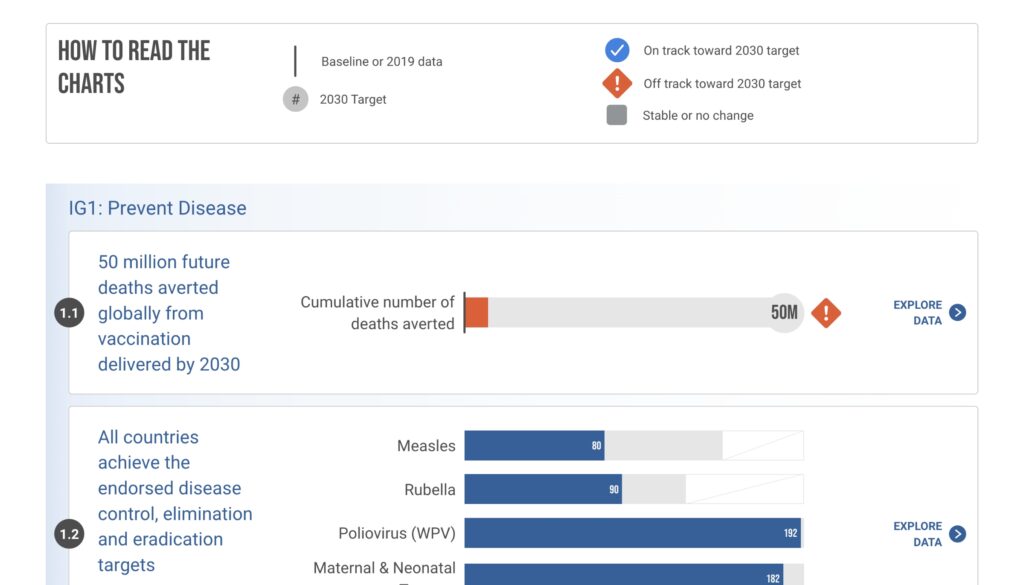
Within the overhauled VIEW-hub, disease burden datasets gained more prominence to help stakeholders make informed decisions and track progress.

Upgrades in speed abound across the platform. Data updates that once took days to publish now appear almost instantaneously, and users on all devices enjoy a much faster loading process.

A montage of visualizations designed by Graphicacy for the VIEW-hub website, a public health platform for vaccine data

"Sponsors and funders are raving about the sophisticated new look. When a tool looks impressive, like this one does, people are more inclined to believe the data, use it more, and share it often. That’s our whole goal for VIEW-hub."


Maria Deloria Knoll, IVAC’s director of epidemiology.

Interested in working on a project like this?