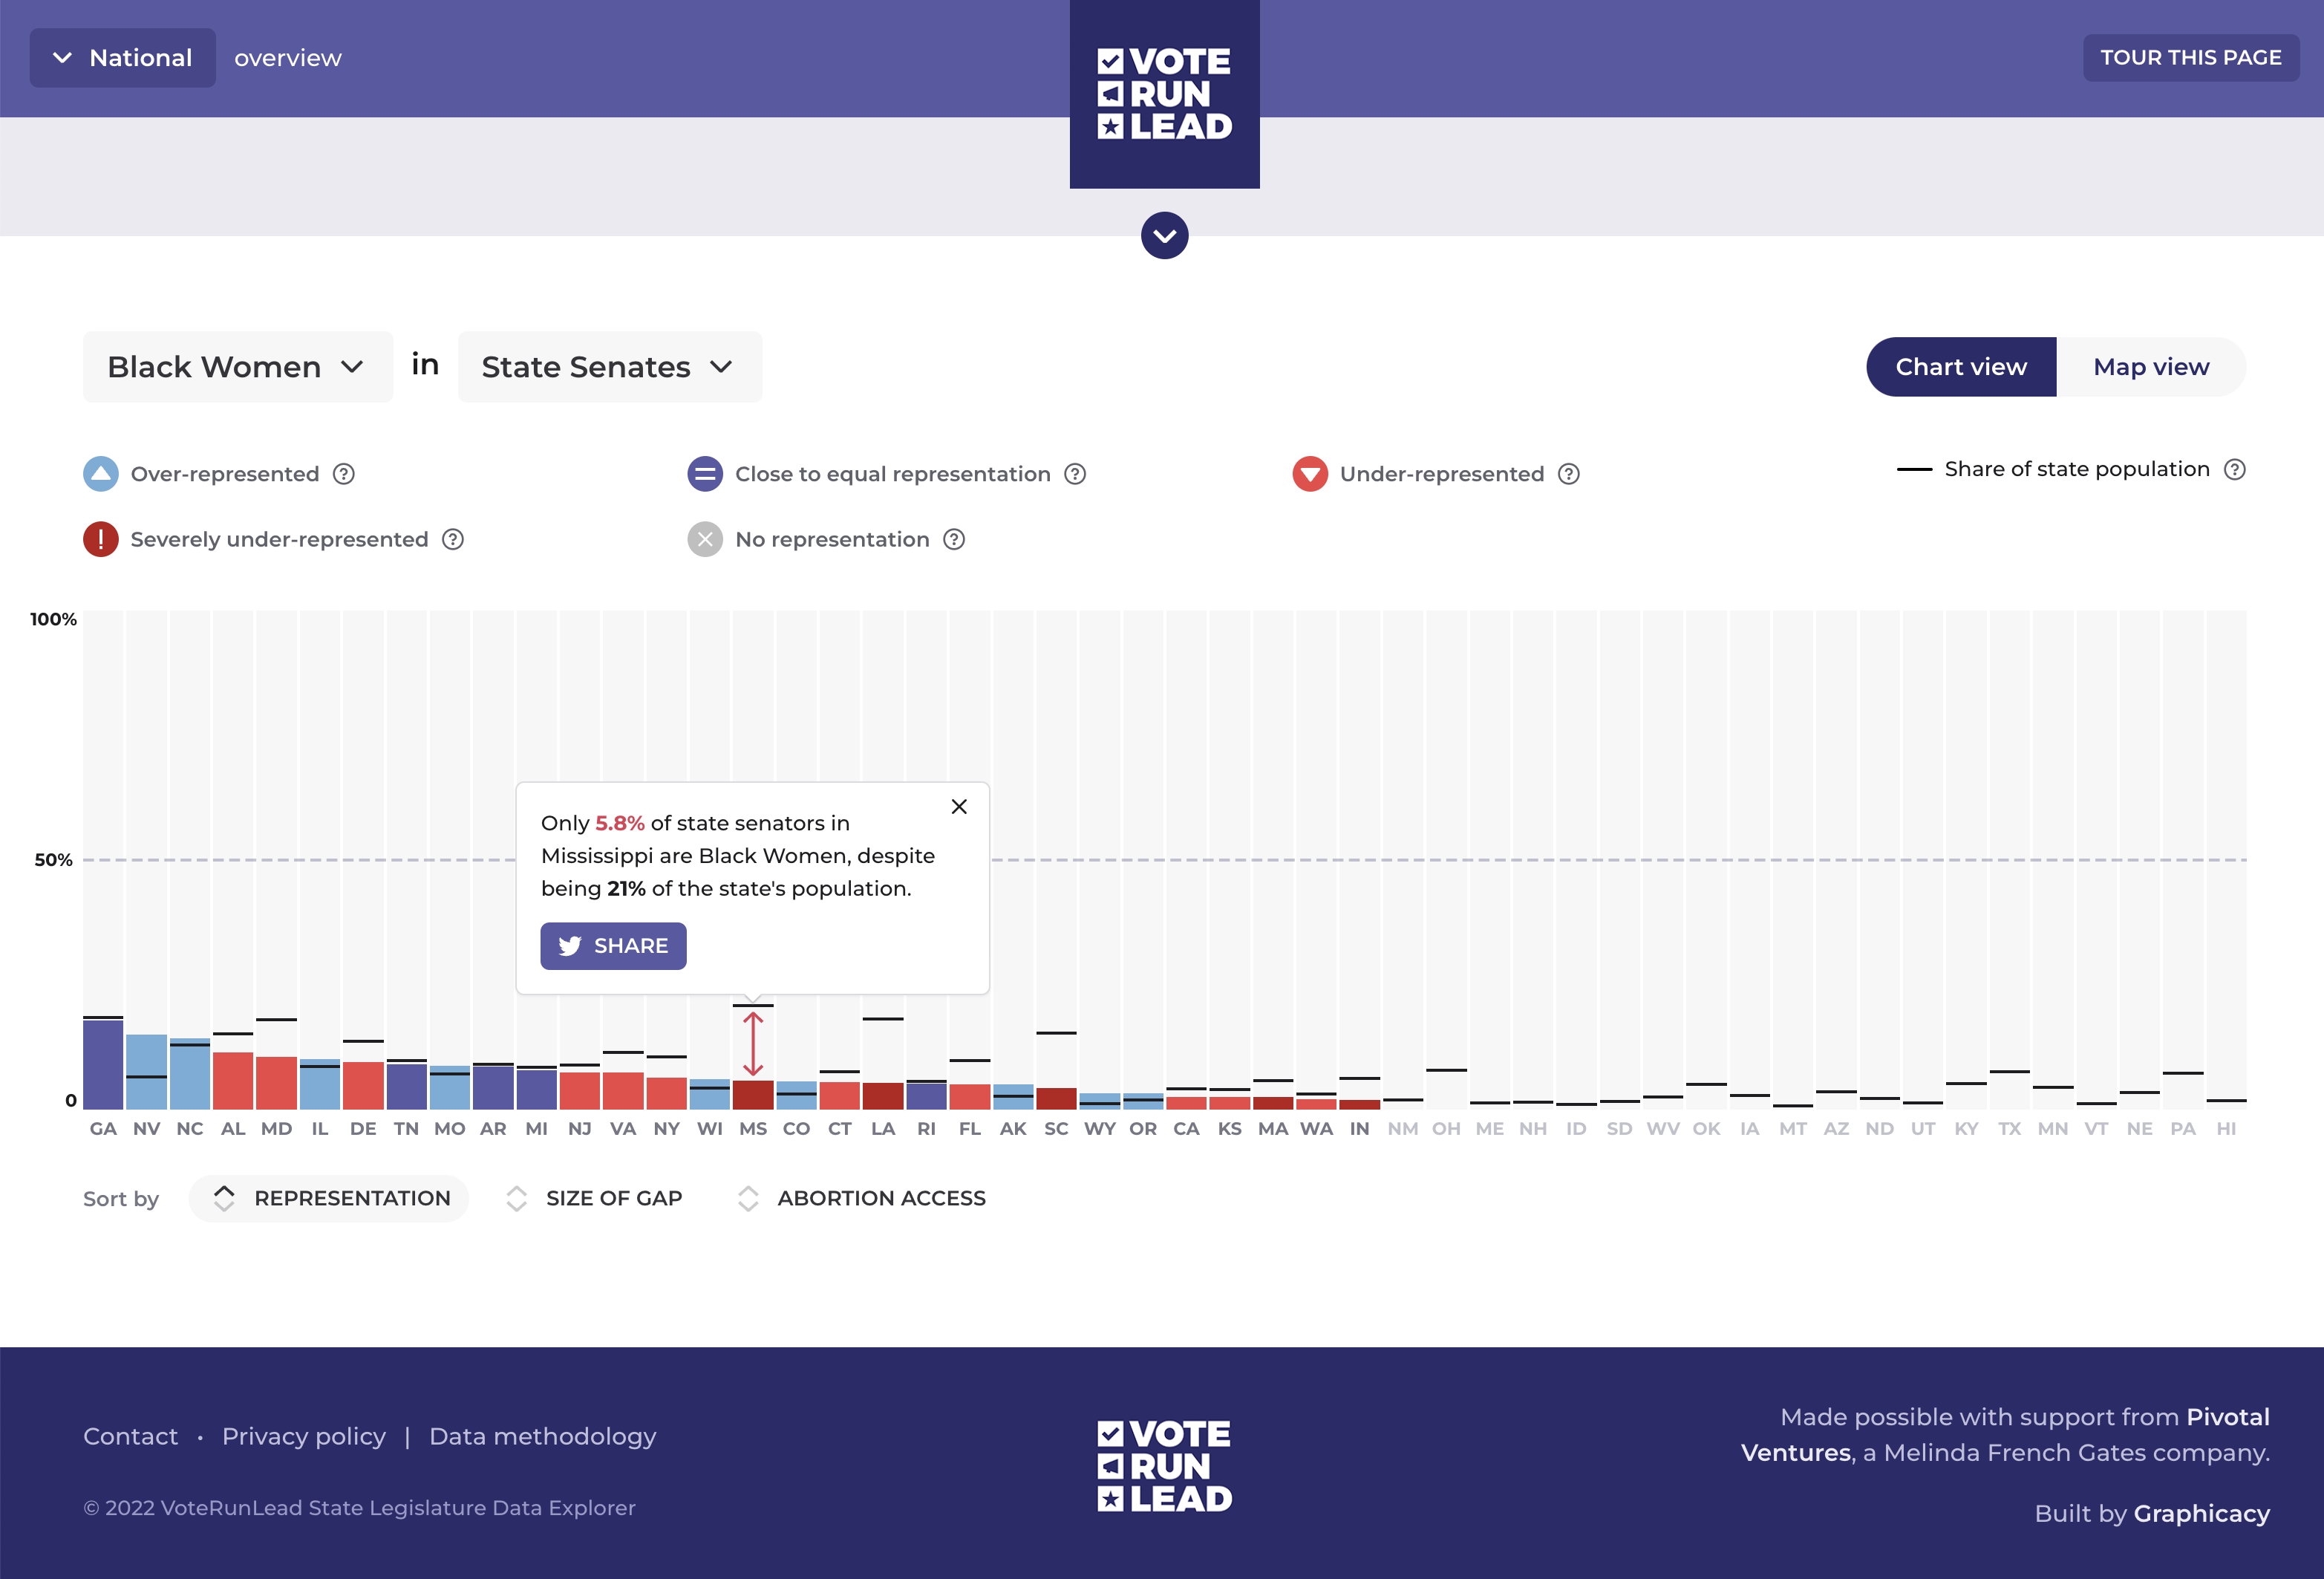
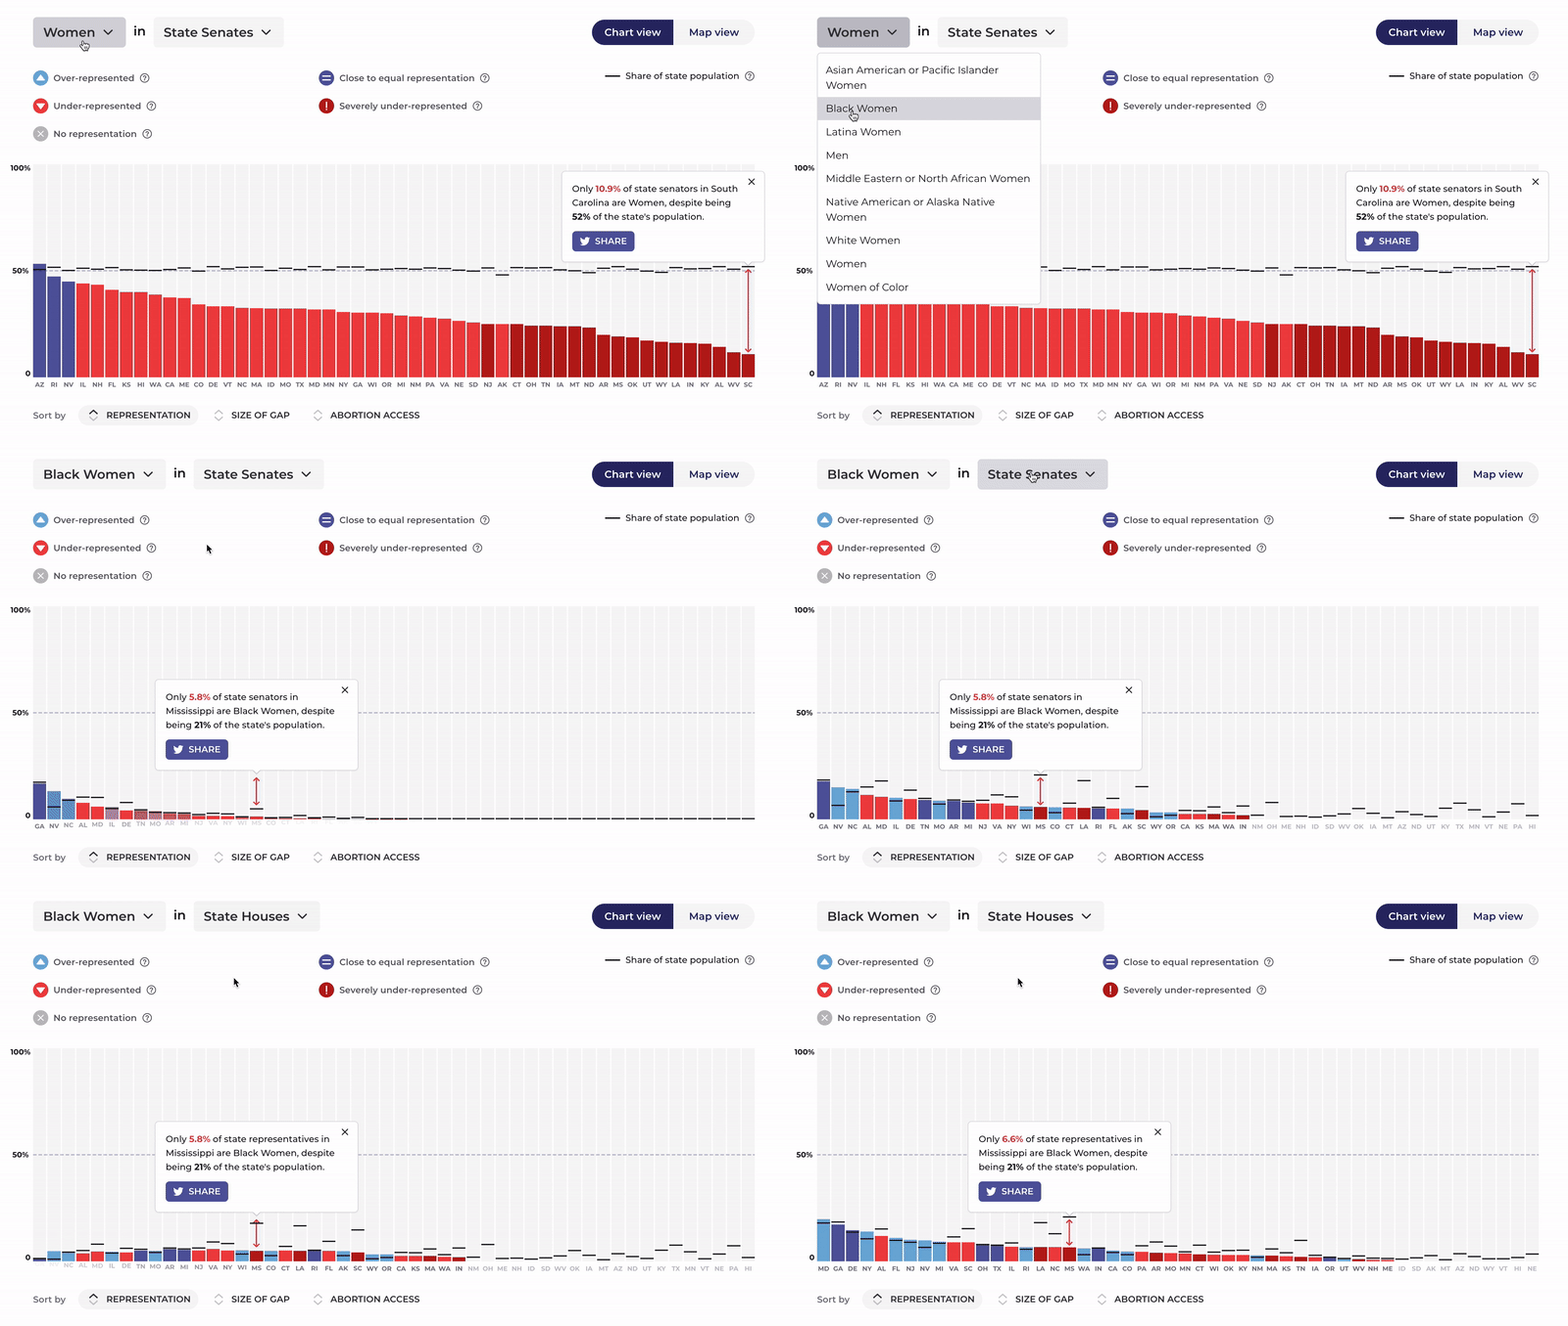
The State of My Democracy explorer offers options for national and state views. In both views, users can see data for different racial and ethnic identity groups as well as for overall women of color. One of the demographic groups included is men, which illustrates the staggering contrast in representation. When there’s a major gap in representation, a preview card appears that users can share on Twitter with a single click.
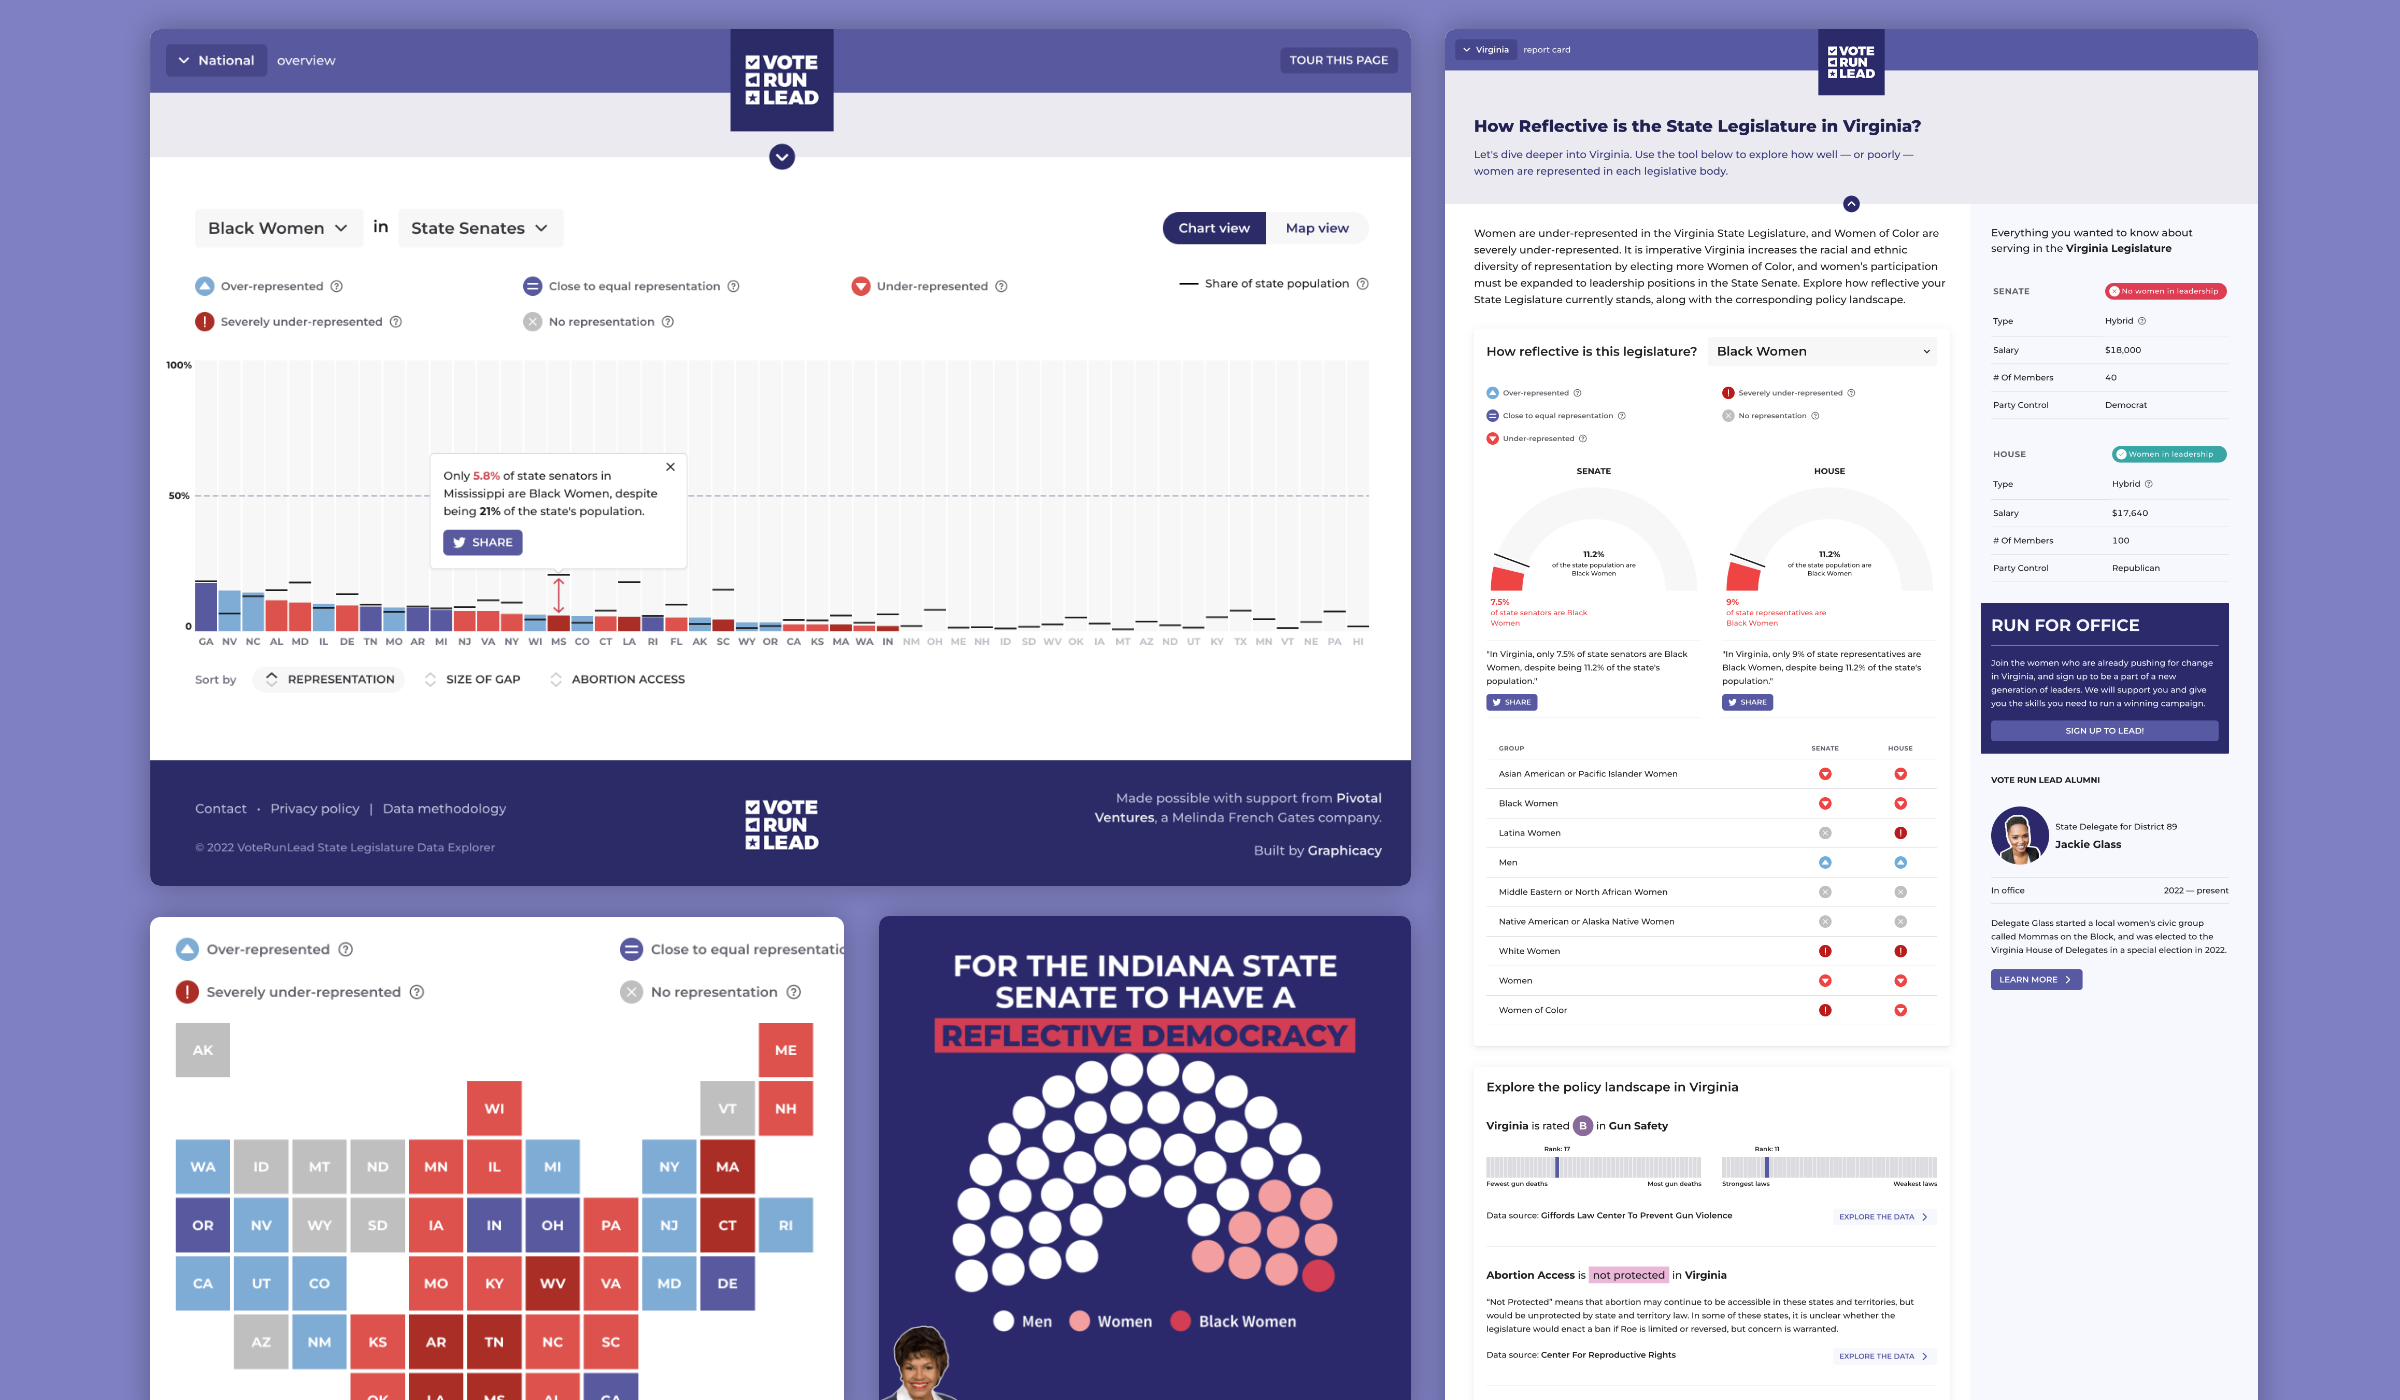
On the National view, Graphicacy built in a “Tour This Page” feature, which sequentially leads users through each design element on the page. It calls out opportunities to sort the chart data by Representation, Size of Gap, or Abortion Access. Users can also view the data in a tile map format.
The state view, meanwhile, gives users a dedicated report card page for every state. Users see each state chamber’s representation gap for the various demographic groups along with helpful information such as state legislators’ salaries, current party control, and Vote Run Lead alumni. To promote VRL’s unique initiatives and encourage Women and Women of Color to run for the state legislature, Graphicacy devised a prominent Run for Office button that directly links to VRL’s Run51. It serves as a call to action for women to sign up to run for office or nominate a co-worker or friend, reaffirming the tools’ dual purpose for education and candidate recruitment.
