Benefits of Closing the Achievement Gap

Center for American Progress / 2015 / Racial Equity

A still from the Graphicacy produced video for Center for American Progress, on the topic of achievement gaps

Overview

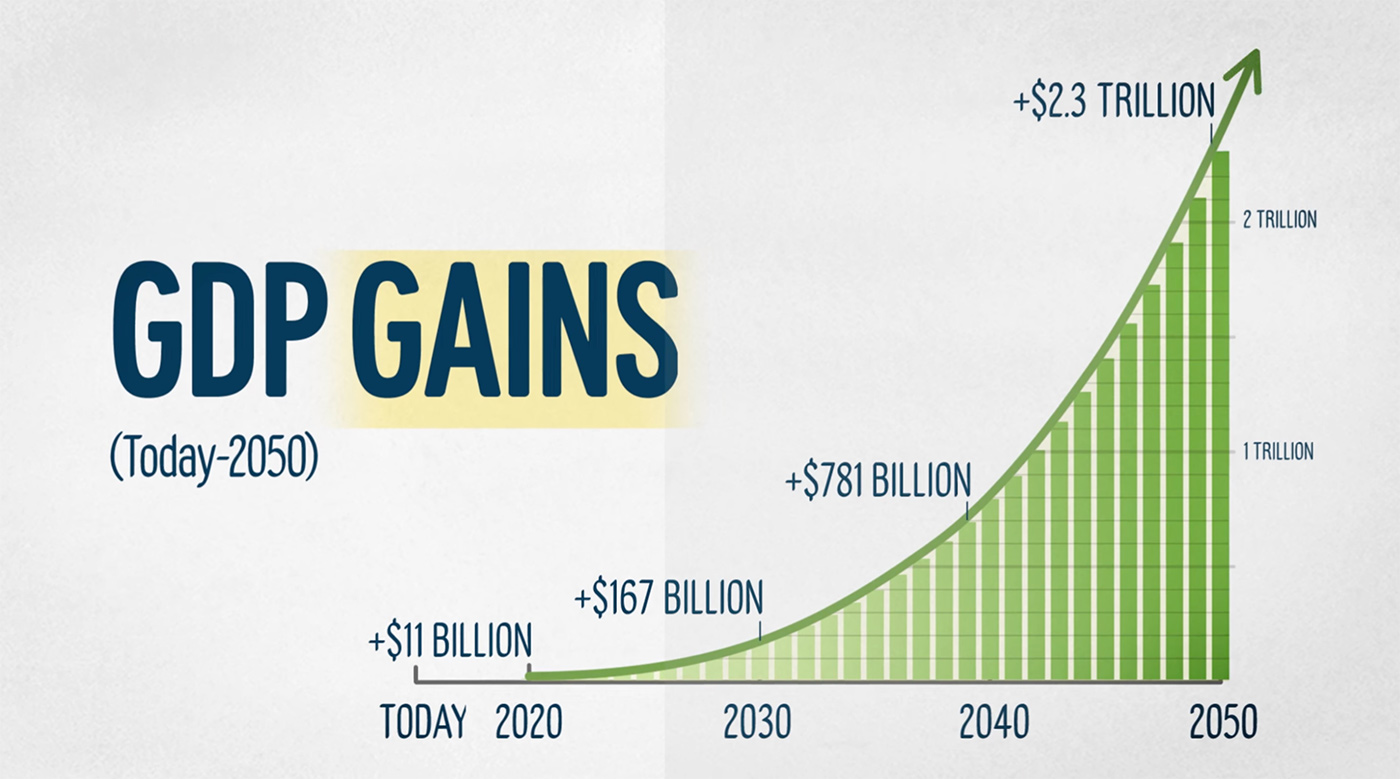
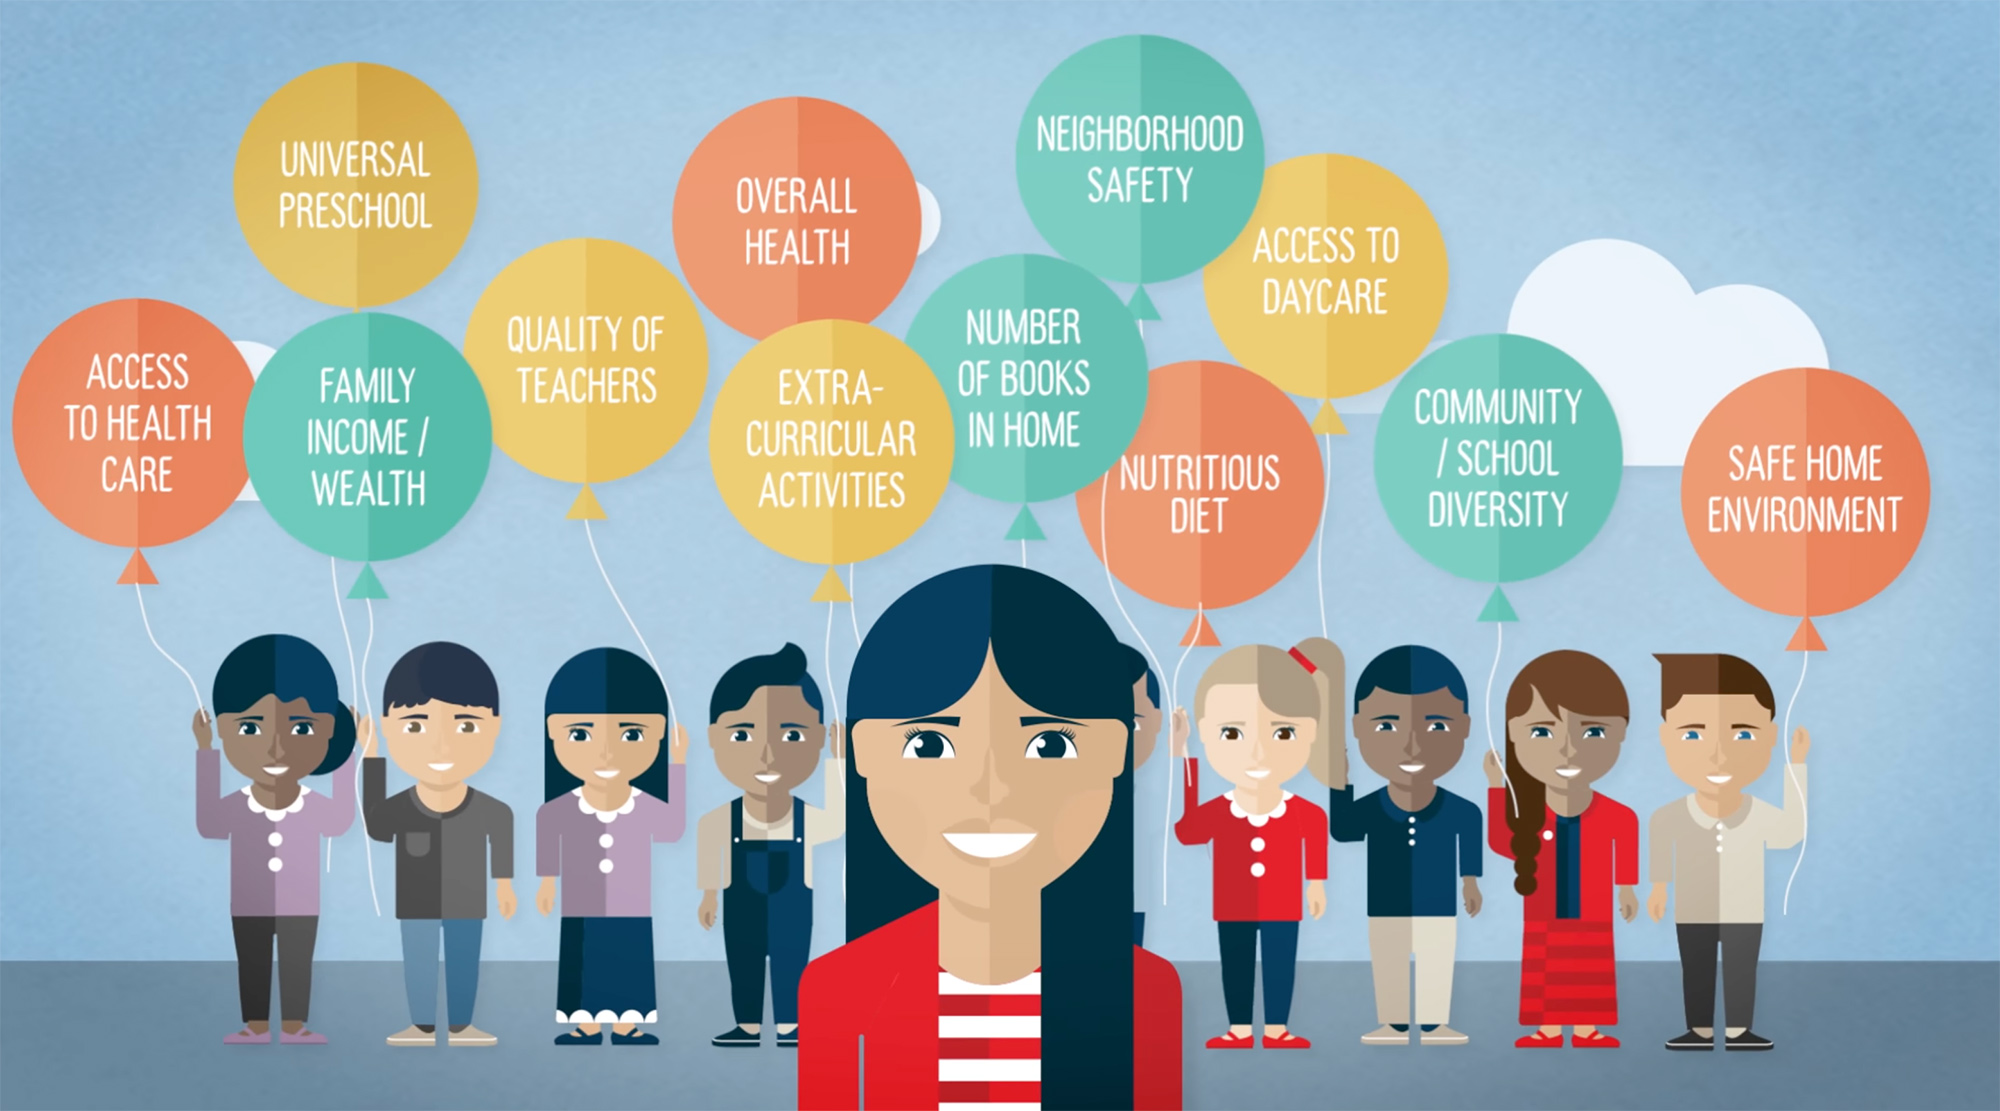
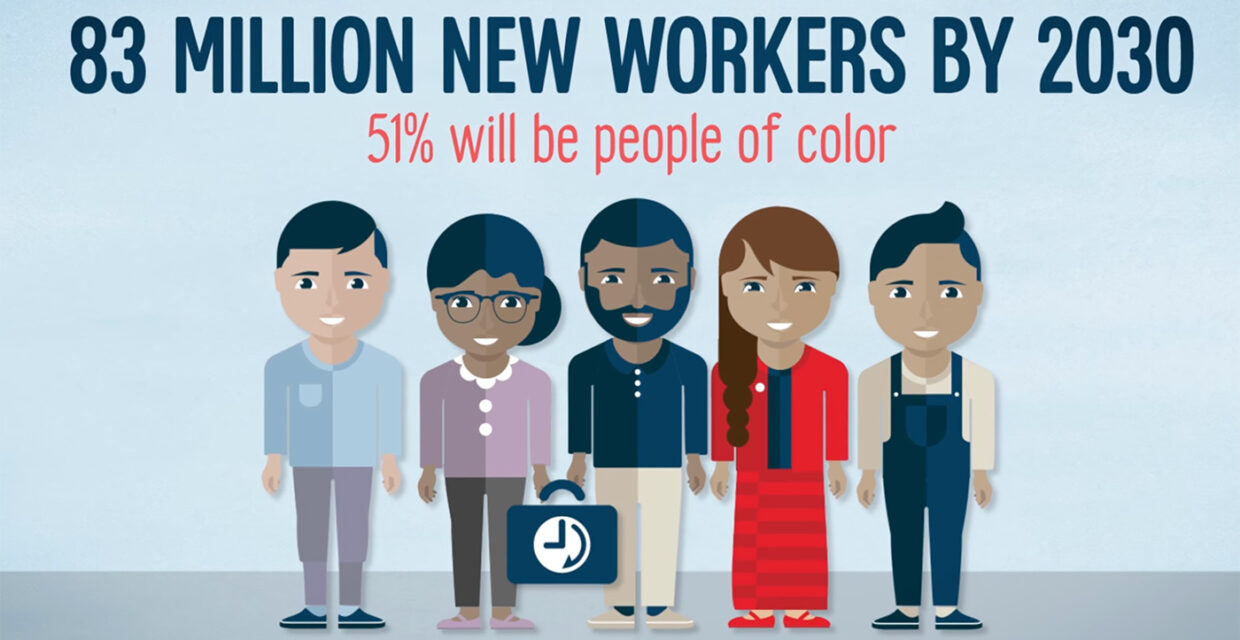
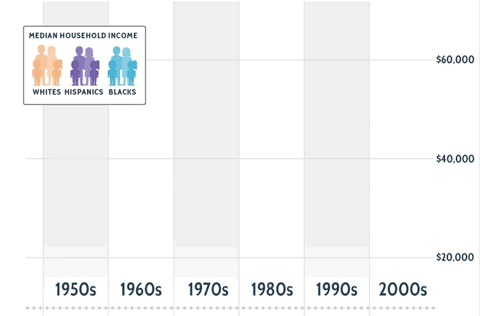
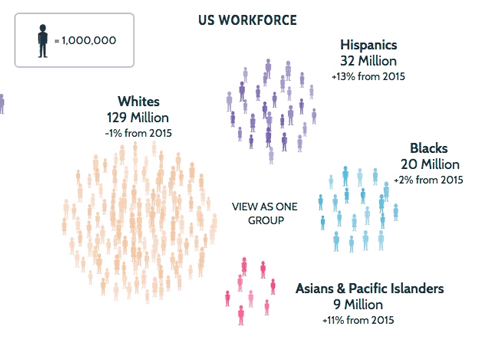
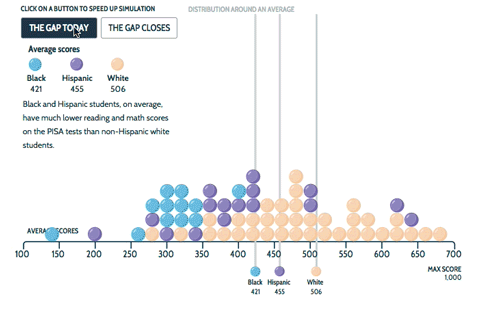
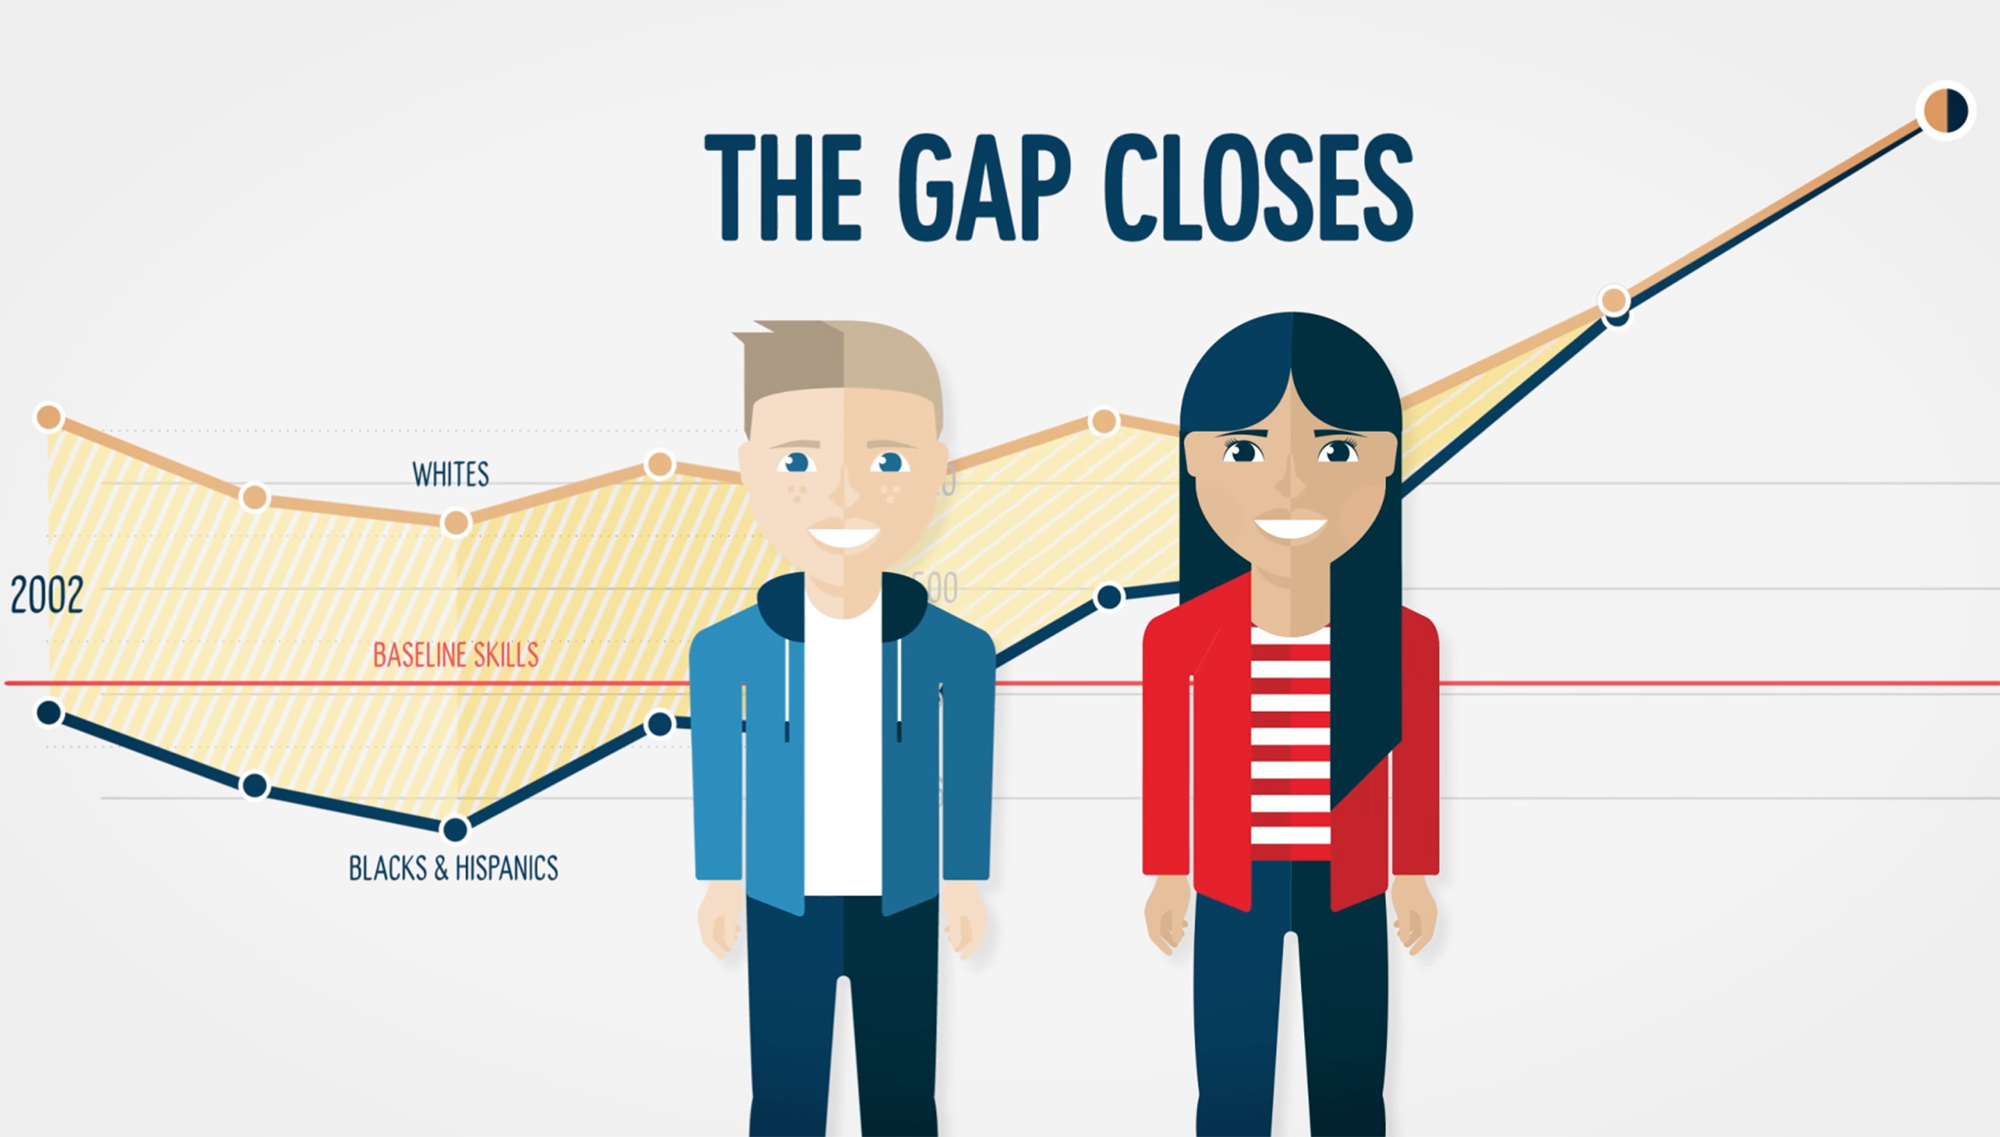
Graphicacy partnered with the Center for American Progress (CAP) to create a motion graphic video and scrolling narrative of interactive data visualizations that illustrate the economic benefits of closing the achievement gap between Black, Hispanic, and white students. Rising income inequality in the United States is exacerbating long-standing racial and ethnic gaps in, among other things, education outcomes. These troubling gaps can begin to open even before a child’s first day of school.

Background and Challenge

The Center for American Progress (CAP) is shaping the national debate about issues that truly matter – including the intersection of education, poverty, and racial disparities. Specifically, CAP is interested in this issue’s powerful impact on the economy and the ability of all American children to reach their full potential.

A team of communications staff, researchers, and subject matter experts from CAP came to Graphicacy to help create an interactive visual storytelling experience that would make this story of race, class, and inequality accessible and activating.

Graphicacy’s task was to ensure this complex and high-profile issue was presented in a way that was engaging and understandable for a general audience, useful for journalists and academics, and a credible and action-provoking tool in the hands of policymakers. Another exciting challenge was to find a way to highlight the evidence-based connection between income level and a child’s performance in school without ignoring the host of other factors that can affect education outcomes.

Opportunity and Solution

CAP’s research, along with others, makes the case that closing achievement gaps will benefit all Americans. This exciting visualization could help inspire action on policies that help close the achievement gap, and investing in these policies will help future workers enter the labor force with greater skills, leading to a more productive economy. Ultimately, this increased productivity will mean higher incomes for all Americans which will in turn help grow our economy.

Working closely with the CAP team, Graphicacy chose three distinctive interactive chart types, stitched together with descriptive text blocks in a scrolling narrative. This layout provided unique “windows” on the report data (see below).

Graphicacy also created a motion graphic video to provide an accessible, easily shareable, “data-light” version of the story that focused on two representative children from different backgrounds to show in a very personal way the impact of having, or not having, access to valuable resources at home to pave the way for a successful future. Both the scrolling data-rich narrative and the video provided prompts to learn more and contact policymakers for action.

animation from the closing the achievement gap project, for Center for American Progress

Understanding Income and Achievement Gaps – We used two line charts that allowed users to toggle between views of long-standing median household income gaps between white, Hispanic, and Black families and academic achievement gaps that over time were strikingly similar.

animation from the closing the achievement gap project, for Center for American Progress

Understanding Changes in The American Workforce – Here we chose an interactive force-directed graph that allowed users to dynamically model the anticipated demographic shifts in the future workforce. Today, 50.3 percent of students in K-12 public schools across America are children of color and by 2030, 51% of the 83 million workers entering the workforce will be people of color.

animation from the closing the achievement gap project, for Center for American Progress

Understanding The Impact of Experiences Outside The Classroom – A distribution chart turned out to be a strong choice for showing how things like children not attending preschool, living in poverty, and not having health insurance coverage impacted the different distribution of math and reading scores between Black, Hispanic, and white students. A toggle option showed how increasing the access of Children of Color to key resources outside of school would really help to close the academic achievement gap.

Interested in working on a project like this?