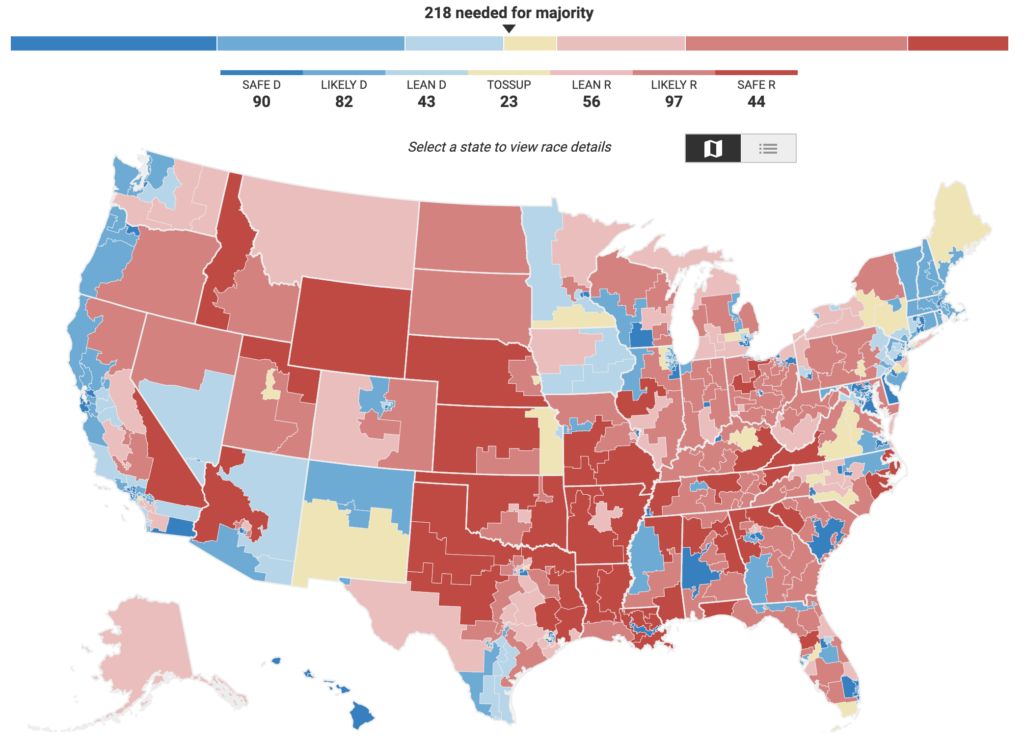
Graphicacy’s team of skilled information designers and data visualization engineers worked to intuitively communicate the impact of this new hybrid organizing model, utilizing a combination of scrolling animations, interactive data visualization and live polling data from FiveThirtyEight. The final product allows users to explore and understand how Working America’s work in key battleground states will increase the share of the progressive vote, and propel Joe Biden and progressive Senate and gubernatorial candidates to victory in the 2020 election.
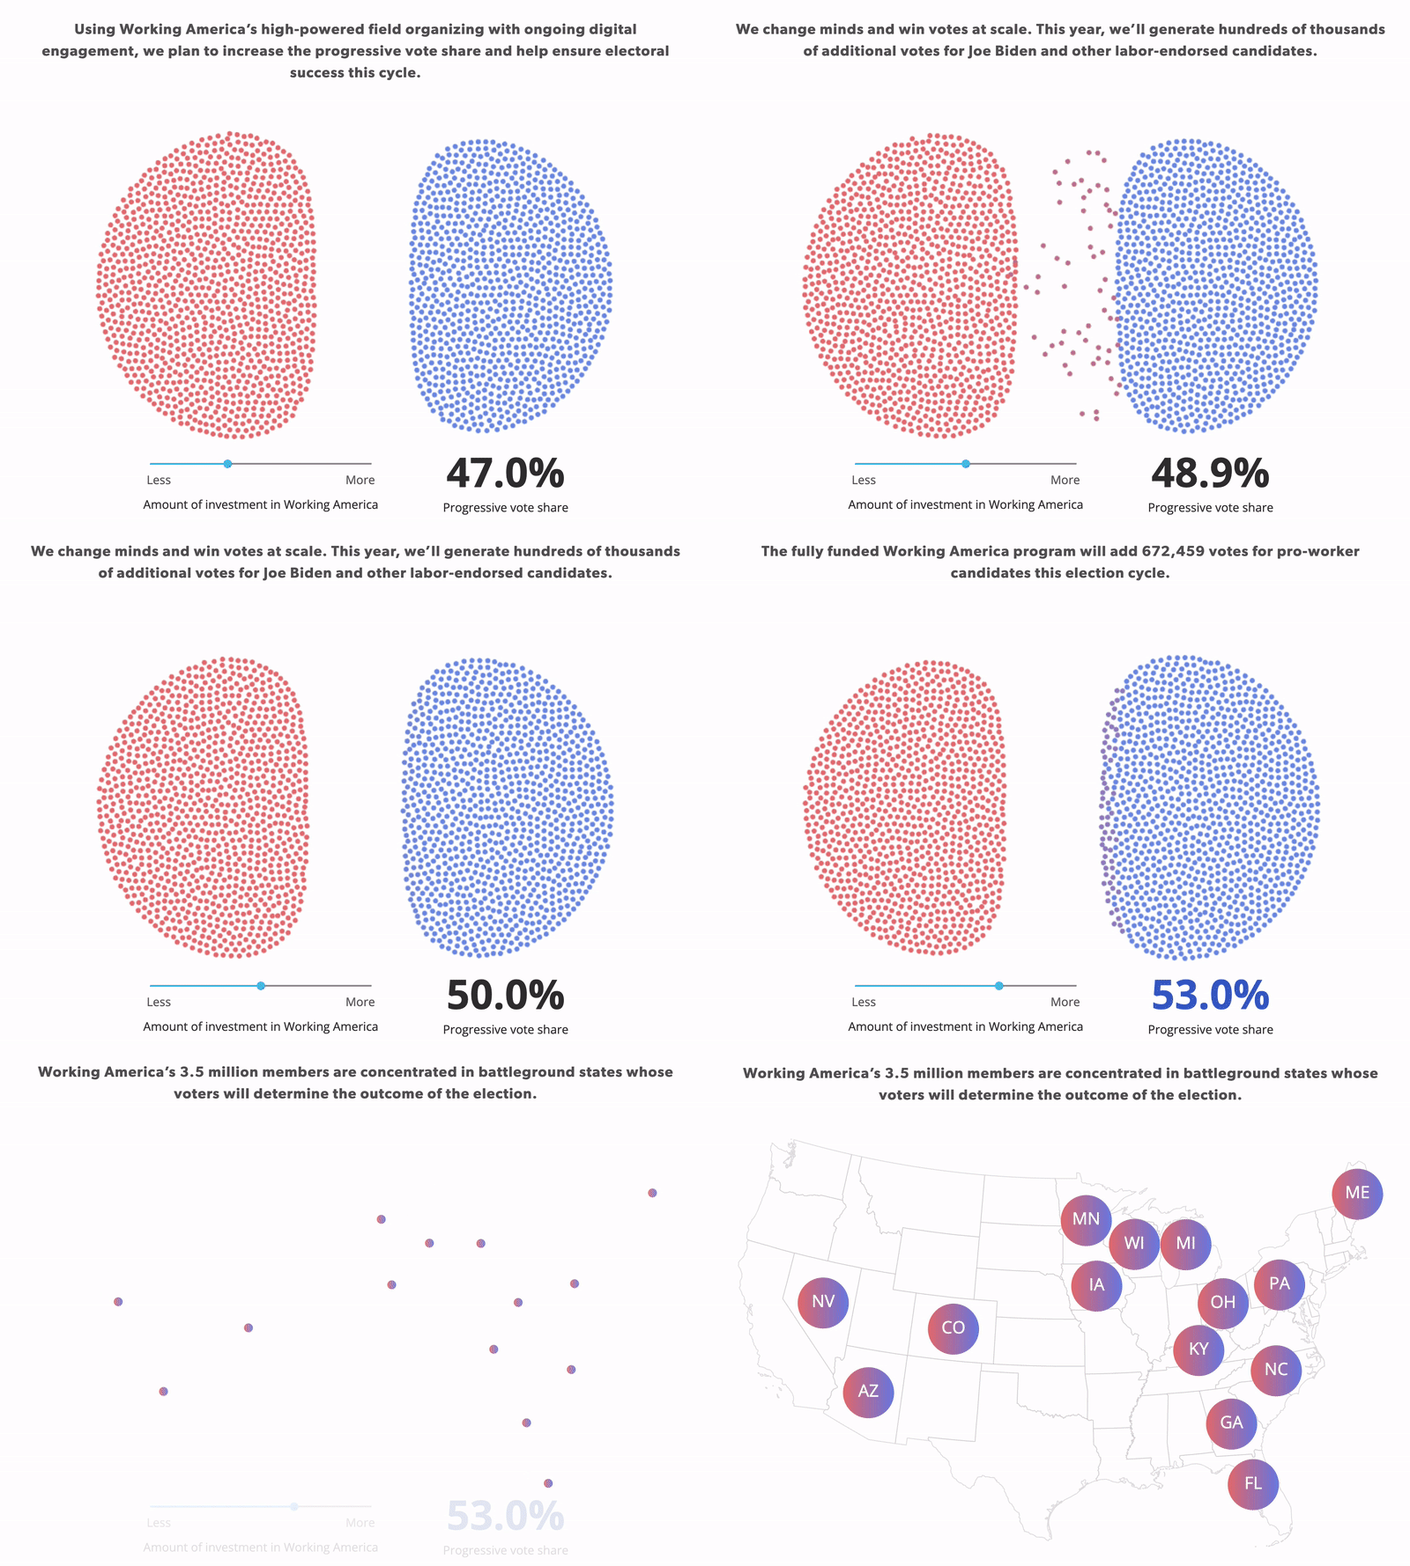
Through an engaging, scrolling narrative, our team was able to lay out key points so that donors could quickly understand where Working America is having an impact in key battleground states:
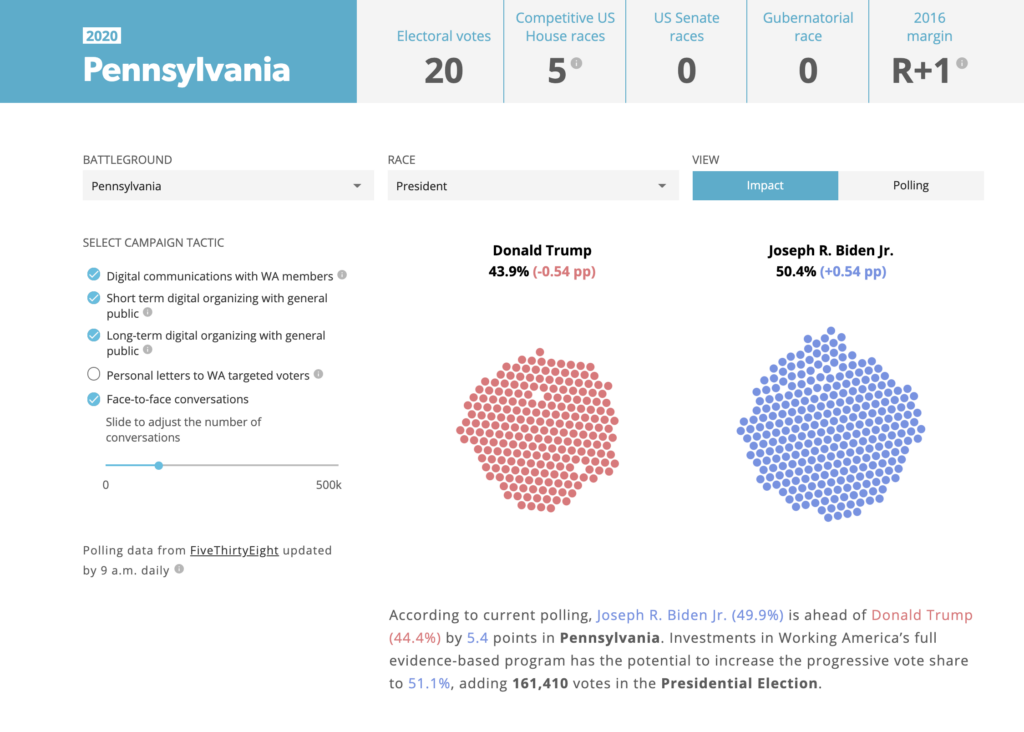
To show the impact within each state, our team designed and built two different interactive views of how, with full investment, Working America’s campaign tactics have the potential to increase vote share and the number of votes.
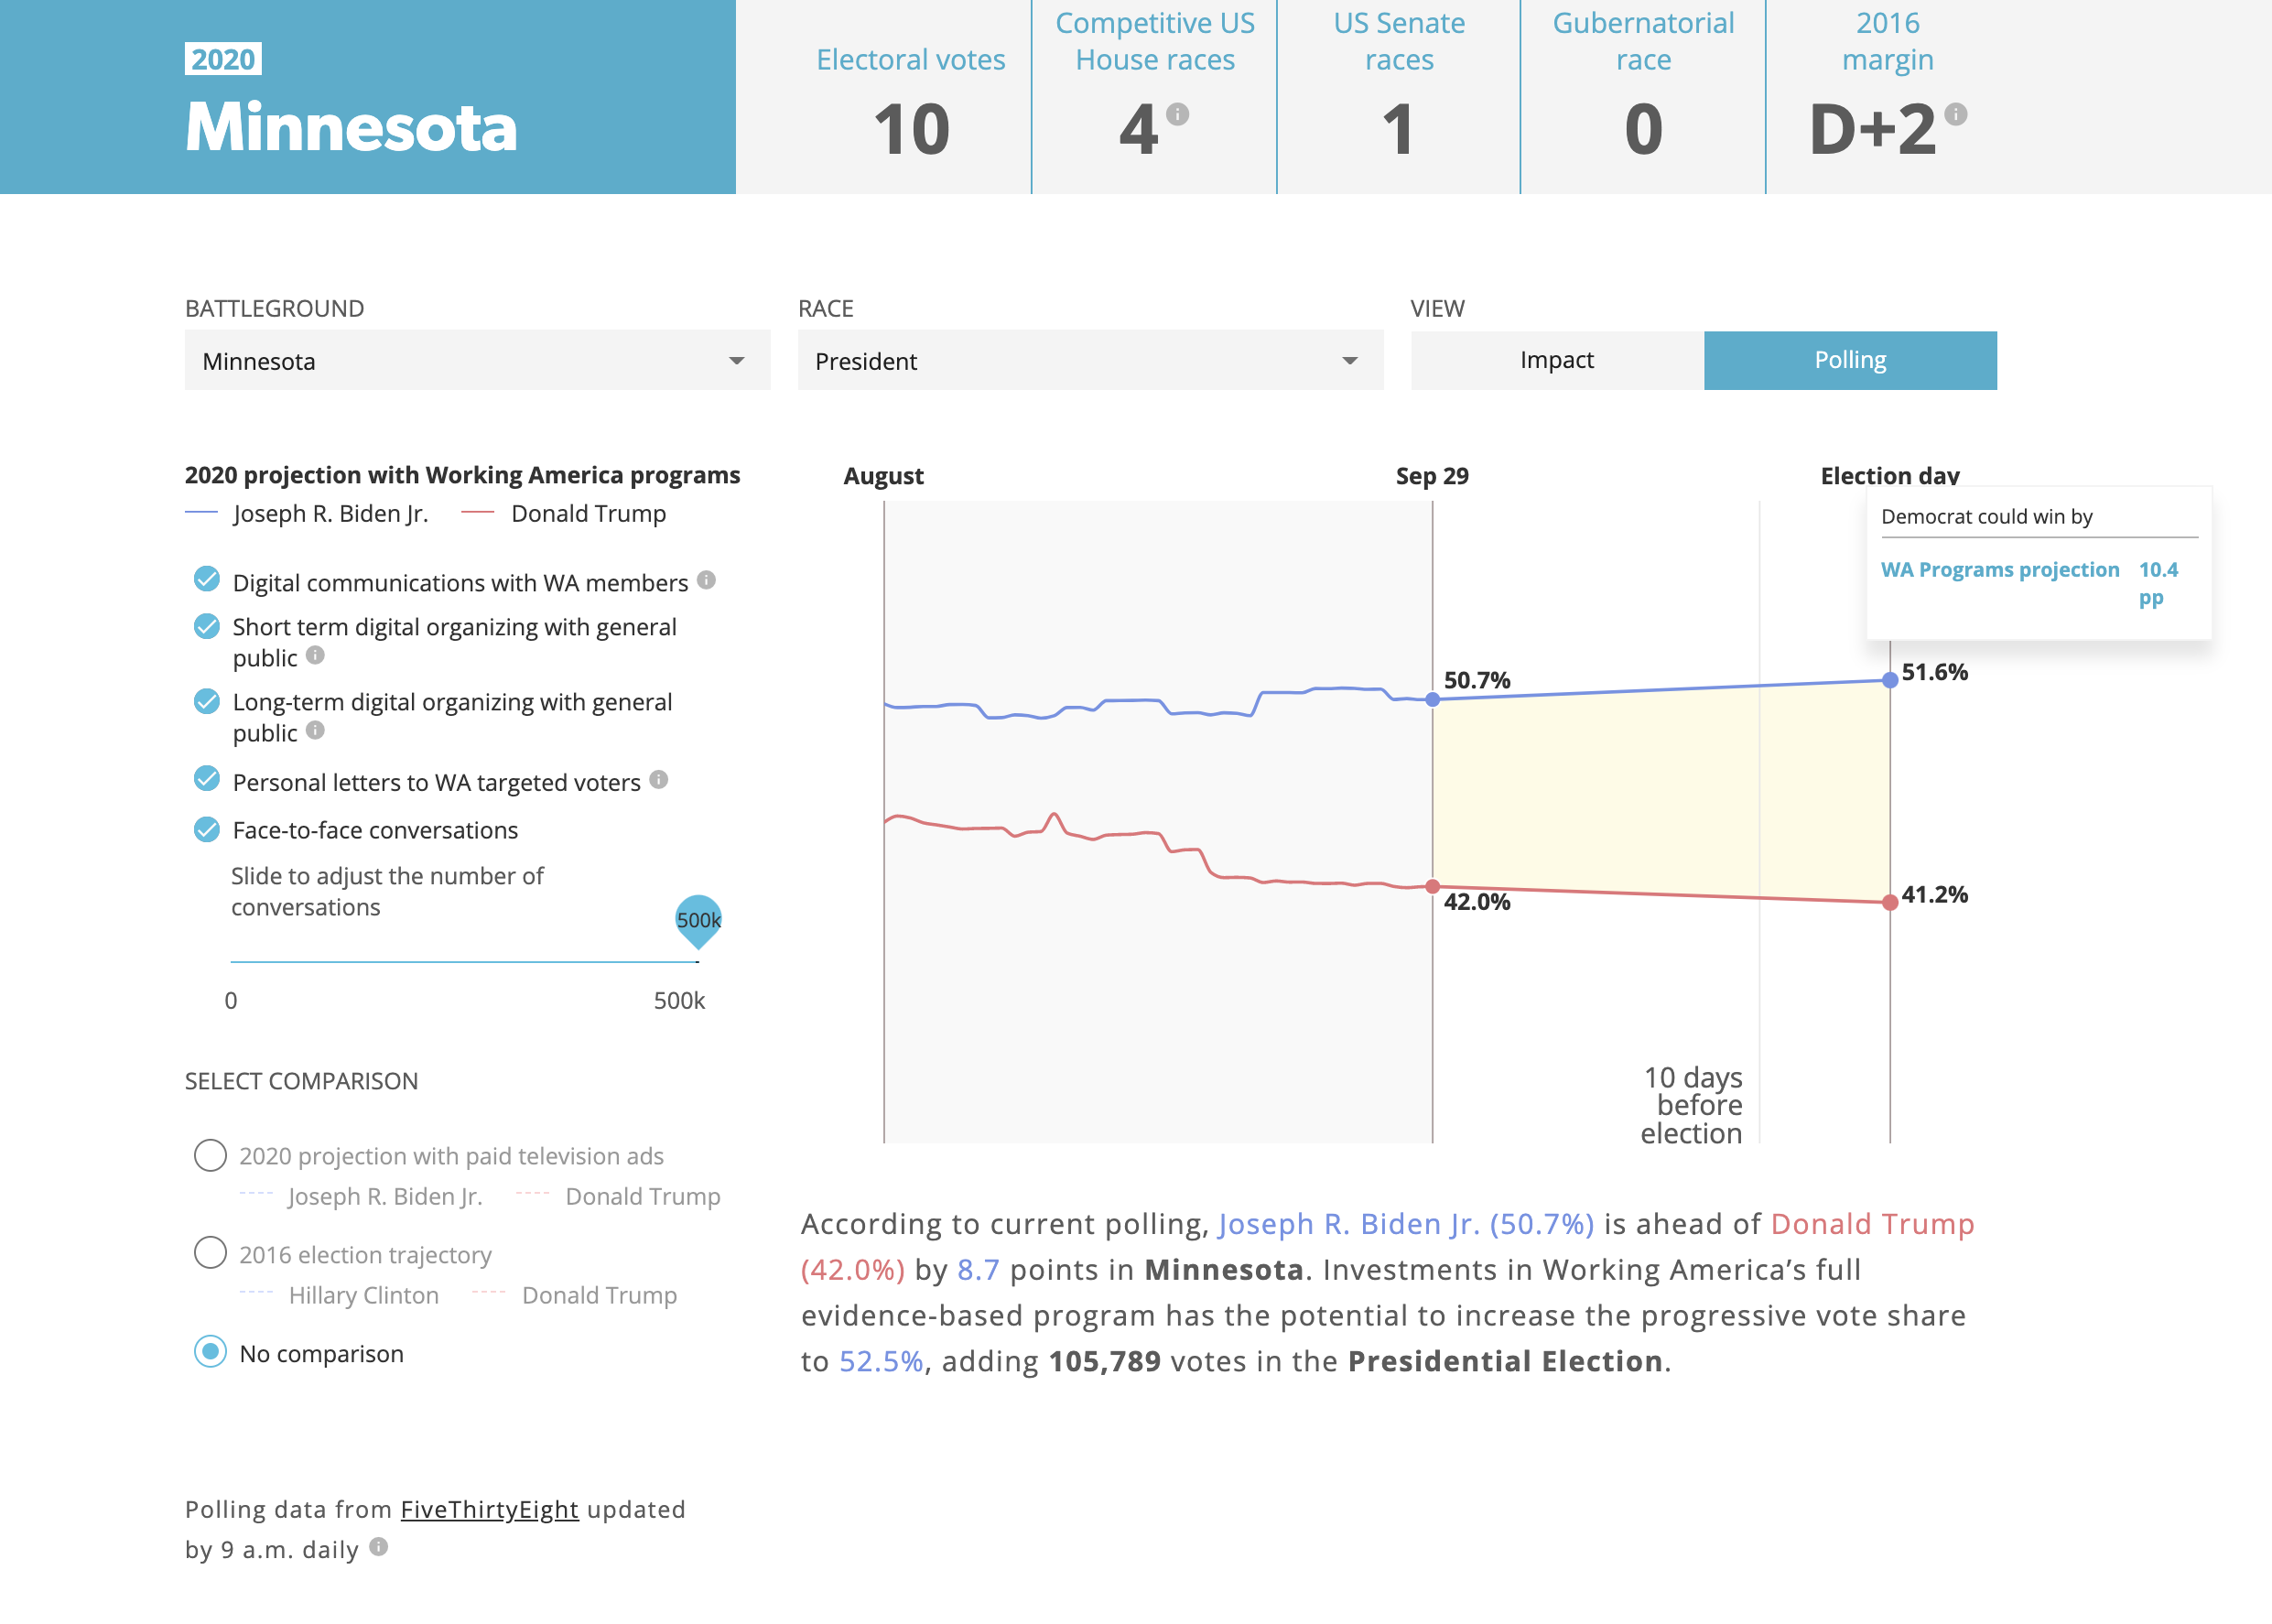
Using polling data from FiveThirtyEight, our team also designed and built a horse-race view of the data, allowing users who are steeped in polling for the presidential race to see live data and the potential impact that Working America’s program, digital and in-person, will have on the outcome of the election.
This project allowed the Graphicacy team to engage in what they do best: dig in with their client partners to examine complex data and then create data visualizations and visual narratives that are relevant, shareable and effective.
